Google™ Search
December 25, 2025
The RBVI wishes you a safe and happy holiday season!
See our
2025 card and the
gallery of previous cards back to 1985.
September 22, 2025
Mac users may wish to defer upgrading to MacOS Tahoe.
Currently on that OS the Chimera graphics window is shifted so that it covers
the command and status lines.
March 6, 2025
Chimera production release 1.19 is now available,
fixing the ability to fetch structures from the PDB
(1.19 release notes).
Previous news...
Please note that
UCSF Chimera is legacy software that is no longer being developed or supported.
Users are strongly encouraged to try
UCSF ChimeraX, which is under active development.

UCSF Chimera is a program for the interactive visualization
and analysis of molecular structures and related data,
including density maps, trajectories, and sequence alignments.
It is available free of charge for noncommercial use.
Commercial users, please see
Chimera commercial licensing.
We encourage Chimera users to try ChimeraX
for much better performance with large structures, as well as other major
advantages
and completely new features in addition to nearly all the capabilities
of Chimera (details...).
Chimera is no longer under active development.
Chimera development was supported by a grant from the
National Institutes of Health (P41-GM103311)
that ended in 2018.

The default ribbon path is a smooth bspline
(semitransparent tan in the figure),
which can diverge from the true positions of the backbone atoms
(α-carbons shown as gray balls).
A cardinal spline allows tracking the backbone more closely.
Without smoothing (light blue), it follows the α-carbons exactly,
or it can be combined with some
“compromise” smoothing of strand and/or coil.
Ribbon spline options can be set with the
ribspline command
or in the molecule
model attributes.
(More features...)
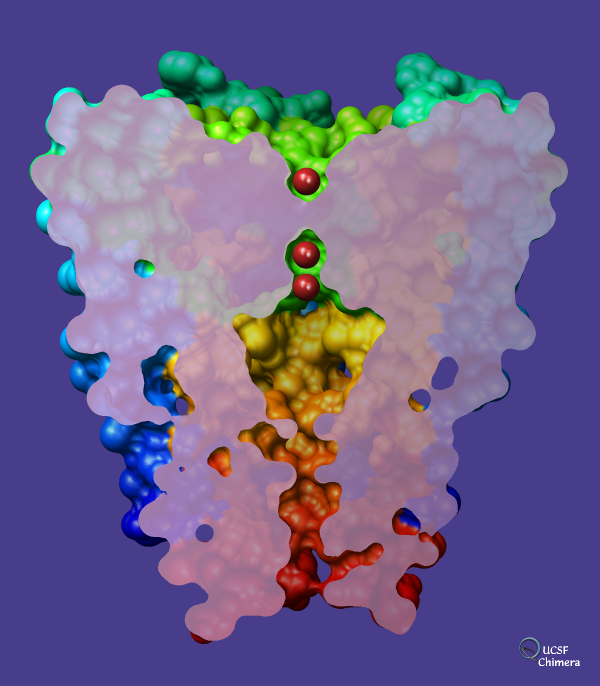
Potassium channel (Protein Data Bank entry
1bl8)
on a dark slate blue background with potassium ions shown in
firebrick.
The channel is comprised of four chains. Each chain has been
rainbow-colored
from blue at the N-terminus to red at the C-terminus,
but only the surface of the channel is shown.
The surface has been sliced with a
per-model
clipping plane. The
surface cap
color is plum except with
opacity
set to 0.8. The
shininess
and brightness have been set to 128 and 8, respectively,
and the
lights
on the scene have been moved from their default positions. The
subdivision quality (related to the smoothness of the spherical ions)
is 5.0, and the molecular surface was computed with
probe radius and vertex density
set to 1.0 and 6.0, respectively.
(More samples...)
About RBVI
| Projects
| People
| Publications
| Resources
| Visit Us
Copyright 2018 Regents of the University of California.
All rights reserved.
