
Feature Highlights

Morphing
Different conformations and even different proteins can be compared by morphing from one structure to another. Users can specify the method of coordinate interpolation and how many intermediate structures should be generated. The result is displayed in Chimera's trajectory viewer, MD Movie. The morph can then be saved in coordinate form or recorded as an animation.
(More features...)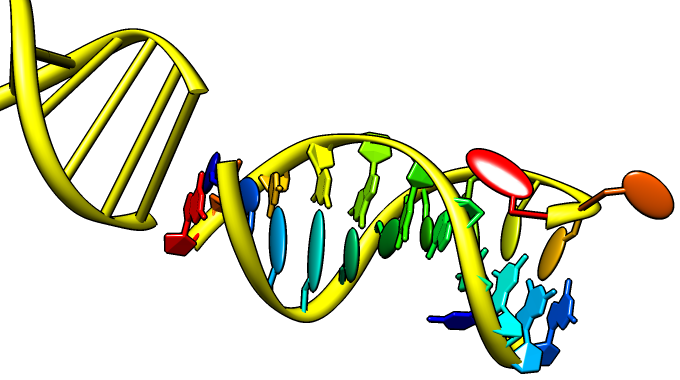
Nucleotides
Special representations of DNA and RNA can be displayed with the Nucleotides tool or the command nucleotides. Different levels of abstraction are available. The figure shows a ribbon backbone combined with the following sidechain (sugar/base) options:
- ladder rungs
- filled-ring atomic representations
- "lollipops" in which bases are shown as ellipsoids and sugars as tubes
Thermal Ellipsoids
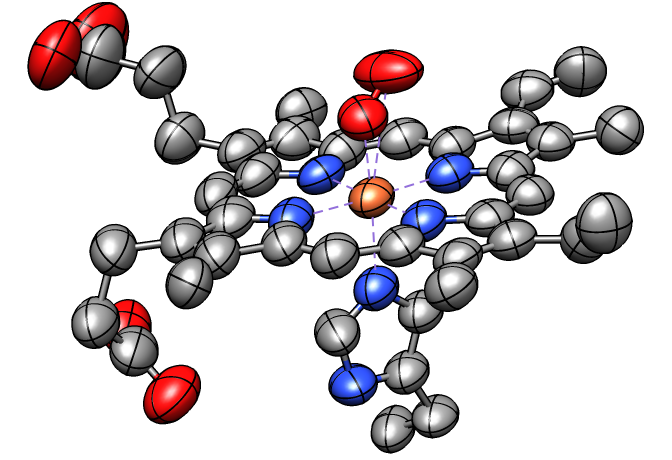
Anisotropic B-factors can be shown as ellipsoids, with ellipsoid axes and radii representing the eigenvectors and eigenvalues of the atomic mean-square displacement matrix. Anisotropic B-factors are read from the input coordinate file (for example, from ANISOU records in a PDB file) and can be displayed with the tool Thermal Ellipsoids or the command aniso. The figure shows ellipsoids scaled to enclose 50% probability for the heme and nearby atoms from PDB entry 1a6m.
(More features...)
 |
 |
Special Backgrounds
The background of the Chimera graphics window can be set to a single solid color, a vertical gradient of multiple colors, or an image read from a file. These and related parameters can be controlled with the command background or in the Background preferences.
Gradients may contain any number of colors, and can be shown as discrete bands or interpolated in the RBG or HLS color space; they can be created, previewed, and named using the Palette Editor. Background images can be cropped, stretched, centered, or tiled. Image formats include PNG, TIFF, and JPEG.
(More features...)
Morphing Density Maps
Related density maps can be compared by morphing from one to the other. Several intermediate maps are generated by interpolating between the starting and ending maps. The morph can be viewed interactively and recorded as a movie. The contour level can be adjusted automatically to keep the enclosed volume constant throughout the morph, and other aspects of map display can be adjusted with Volume Viewer.
(More features...)|
|
Interactive Shadows
Interactive shadows (shadows that move as structures are moved) can be enabled in the Effects dialog or with the command set shadows. Click the image to show a small molecule rotating above a rectangular plane. This simple animation was made with the Chimera command script tumble.com. Interactive shadows also work with ribbons, surfaces, and other representations.
(More features...)
Fly-through Animation
The fly command can animate a flight through molecular structures. Click the example image to fly along the RNA being copied by rotavirus RNA polymerase (PDB 2r7r), an enzyme that replicates the 11 segments of viral RNA.
(More features...)
 |

|
Annotations from UniProt
The PDB/UniProt Info tool retrieves sequence and structure annotations for Protein Data Bank (PDB) entries using a Web service provided by the RCSB PDB. Sequences are displayed in Multalign Viewer, and feature annotations from UniProt are mapped onto the sequences as regions or colored boxes. In the region browser (figure at right):
- making a region Active selects any corresponding structure residues for further operations; only one region can be active at a time
- making a region Shown displays it in the sequence window
- the square color wells show (and allow changing) the region interior and border colors
 |
|
") |
 |
Blast Protein
The Blast Protein tool performs a blast or psiblast search of pdb or nr for sequences similar to a query, using a Web service hosted by the UCSF RBVI. The query can be:
- a chain from a structure open in Chimera
- a sequence pasted as plain text
- a sequence from an alignment in Multalign Viewer
- as a pseudo-multiple sequence alignment (a consolidation of the pairwise alignments of individual hits to the query), automatically shown in Multalign Viewer
- as structures (for hits from pdb), automatically superimposed according to the pseudo-multiple alignment


CASTp Pocket Data
Structures and their pocket measurements can be fetched directly from the Computed Atlas of Surface Topography of proteins (CASTp) database or read from local files previously returned by the CASTp server. In Chimera, the pockets are shown in a pocket list. Choosing rows in the list performs actions such as zooming in on pockets and selecting the surrounding atoms.
The figure shows the four largest pockets by volume identified by CASTp for PDB entry 1ovh (a cavity mutant of T4 lysozyme), shown in yellow, orange, pink, and magenta in order of decreasing volume. The largest is lysozyme's active site, with two openings. The second largest is the engineered cavity. Mutated positions are shown in red. Green balls are Cl– ions.
(More features...)
User-Driven Analysis
Users can easily import structure-related data into Chimera in the form of attributes, or values associated with atoms, residues, or models. The data can be imported with Define Attribute and then represented visually with color ranges, atomic radii, or "worm" thickness. Such data can also be manipulated programmatically in Chimera, and in fact Chimera was designed with extensibility and programmability in mind. It is largely implemented in Python, with certain features coded in C++ for efficiency. Python is an easy-to-learn interpreted language with object-oriented features. All of Chimera's functionality is accessible through Python and users can implement their own algorithms and extensions without any Chimera code changes, so any such custom extensions will continue to work across Chimera releases. Many programming examples are provided to assist extension writers.
(More features...)
Space Navigator Input Device
Space Navigator is an inexpensive ($60) USB input device from 3Dconnexion for moving and rotating models in 3 dimensions. This animation (8 Mb) shows docking a phage enzyme (PDB 1v0e) into an electron microscopy map (EMDB 1333) using a space navigator and mouse. Works with Windows and Mac Chimera versions (details).
(More features...)

Distance Maps and Contact Maps
RR Distance Maps creates a distance map, a generalization of a protein contact map in which residue-residue distances are shown with color gradations. The map can show the Cα-Cα distances within an individual protein chain or the averages and standard deviations for multiple related chains (as in the figure). A simple binary coloring like a standard contact map can also be obtained.
(More features...)

|
Multiple Sequence Alignment
Multiple sequence alignment of structure chains in Chimera or realignment of the sequences in an existing alignment can be performed using web services hosted by the UCSF RBVI. The following programs are provided:
The result is automatically shown in Multalign Viewer. (Sequences can also be added to an alignment one by one without a web service, but true multiple sequence alignment is often advantageous.) (More features...) |
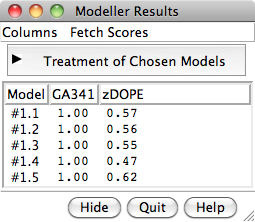 |
Chimera Interface to Modeller
Chimera provides a graphical interface to running the program Modeller, either locally or via a web service hosted by the UCSF RBVI. Two types of calculations are available:
- Comparative (homology) modeling.
Theoretical models of a protein target are generated
using at least one known related template structure
and a target-template sequence alignment. There are
several ways
to generate these inputs in Chimera. See also the
Comparative Modeling
tutorial.
- Building parts of a protein without using a template. Missing segments can be built de novo, or existing segments refined by generating additional possible conformations.

Find and Summarize Structures for a Sequence
One use of Multidomain Assembler is to set up comparative modeling and concatenation of existing structures to generate a full-length model of a multidomain protein. However, even without model-building, the byproduct is also useful: a visual summary of the structures available for a query sequence, optionally filtered by criteria such as BLAST score and % identity, laid out horizontally in approximate N→C order relative to the query. Overlapping hits are stacked vertically, and segments without structural coverage are indicated with spheres. By default, the multiple sequence alignment of the hits to the query is also displayed.
The figure shows the results of command:
mda p08648 ~/Desktop/MDA limit 4 percent 50
with sequence mismatches in red and molecules other than the hit
chains in blue. Text and pointers have been added with
2D
Labels.
Multidomain Assembler is described in a paper.
(More features...)

Superimposing Structures
There are several ways to superimpose structures in Chimera:
•
MatchMaker performs a fit after automatically identifying
which residues should be paired.
Pairing uses both sequence and secondary structure,
allowing similar structures to be superimposed even when
their sequence similarity is low to undetectable.
The figure shows five distantly related proteins
(pairwise sequence identities <25%) from the
SCOP WD40 superfamily before and after
MatchMaker superposition with default parameters.
•
Structures can be matched
using a pre-existing sequence alignment.
•
The exact atoms to pair can be specified with the
match command.
This works on any type of structure, while the preceding methods
apply only to peptide and nucleotide chains.
•
Structures can be superimposed manually by
activating/deactivating them for motion and
using the mouse.

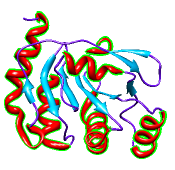
Structure-Based Sequence Alignment
Given two or more superimposed structures,
Match→Align creates a corresponding sequence alignment.
The user specifies a distance cutoff for residues allowed to be
in the same column of the output alignment.
In proteins, the distances are measured between α-carbons.
The method is independent of residue types and how the
structures were superimposed.
The figure shows a superposition from
MatchMaker
of five proteins from the
SCOP WD40 superfamily
and a corresponding sequence alignment from
Match→Align, automatically shown in
Multalign Viewer. In the sequence alignment,
light green and yellow boxes indicate strands and helices, while the
headers
RMSD and Conservation show spatial and sequence
conservation, respectively.
Screening Docked Molecules

Given the structures of ligand and receptor molecules, docking programs calculate possible binding modes. In virtual screening, small organic compounds (typically from a database of many thousands) are treated as possible ligands, and a target macromolecule is treated as the receptor.
ViewDock facilitates the interactive selection of compounds from the output of docking programs, including DOCK and Glide. The hits can be viewed in the context of the binding site and sorted or screened by various properties such as score or number of hydrogen bonds to the receptor. The Dock Prep tool can be used to prepare structures for docking or other calculations by adding hydrogens, assigning partial charges, and performing other related tasks.
(More features...)
Showing ConSurf Results
The ConSurf Server provides results as Chimera Web data; after browser configuration, a single click displays the color-coded query structure and multiple sequence alignment with phylogenetic tree and custom headers in a locally installed copy of Chimera (details).
Special thanks to Elana Erez and the Ben-Tal and Pupko groups at Tel Aviv University, and to Fabian Glaser at the Technion.
(More features...)

|
Coloring by Conservation
A structure can be colored to show attributes such as residue conservation. Opening a sequence alignment in Chimera shows it in Multalign Viewer and automatically associates sequences with structures as appropriate. Residues of alignment-associated structures are assigned conservation values; available measures include entropy, variability, and sum-of-pairs. The figure was created using the PFAM Carb_anhydrase seed alignment PF00194_seed.slx (see image) and includes 2D labels and a color key. See also: mapping sequence conservation
(More features...)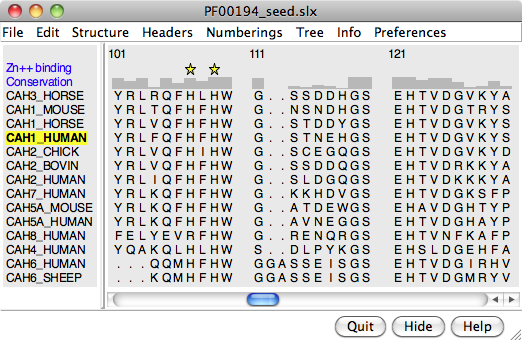

Axes and Planes
Axes, planes, and centroids can be calculated from sets of atoms using the Axes/Planes/Centroids tool or the command define. Axes can be shown as cylinders, planes as disks, and centroids as spheres, and any of these can be used in distance and angle measurements.
For example, the figure shows the dopamine D3 receptor and bound inhibitor (PDB entry 3pbl) as modeled into the membrane in the OPM database. The planes of the inner and outer membrane boundaries are shown as transparent blue and red disks, respectively. The protein ribbon is rainbow-colored from blue at the N-terminus to red at the C-terminus, and the axis of each helix is shown as a cylinder of matching color. The axis of the red helix forms an angle of 15.1° with the membrane and comes within 3.5 Å of the inner boundary. The yellow and orange helices are nearly antiparallel (crossing angle 5.9°). The average (minimum, maximum) distance of inhibitor atoms from the outer boundary is 7.9 (5.1, 11.7) Å.
(More features...)

Sequence Viewer
The Multalign Viewer tool displays individual sequences and multiple sequence alignments. Sequence alignments can be read from external files (several formats) or created by other tools in Chimera. Structures opened in Chimera are automatically associated with sufficiently similar sequences in the alignment. After association,
- mousing over a residue in the sequence shows its structure residue number
- selecting in the sequence selects residues in the structure(s) and vice versa
- structures can be superimposed using the sequence alignment

Ribbon Spline Options
The default ribbon path is a smooth bspline (semitransparent tan in the figure), which can diverge from the true positions of the backbone atoms (α-carbons shown as gray balls). A cardinal spline allows tracking the backbone more closely. Without smoothing (light blue), it follows the α-carbons exactly, or it can be combined with some “compromise” smoothing of strand and/or coil. Ribbon spline options can be set with the ribspline command or in the molecule model attributes.
(More features...)
Ramachandran Plot
Protein backbone angles can be shown in a Ramachandran Plot along with probability contours (green lines) from a reference set of well-determined structures. Each amino acid residue is shown as a dot in a graph of φ vs. ψ, more commonly known as a Ramachandran plot or Ramachandran map. Residues are shown as blue dots, or when selected, as red dots. In the example, all helix residues have been selected. Conversely, clicking a dot in the plot will select the corresponding residue in the structure. When the plot has mouse focus, the cursor position (x = φ, y = ψ) is reported under the plot.
(More features...)
Simple Line Drawing
A simple, line-drawing-like appearance can be achieved by combining black silhouette edges with flat, ambient-only lighting. The image at left of a small molecule in ball-and-stick style can be generated with a few Chimera commands. The same visual effects can be applied to ribbons and other representations, as shown in Neuraminidase Flowers and other Image Gallery entries.
(More features...)
Density Display
Electron density maps can be read from local files or fetched from databases. Chimera's Volume Viewer allows adjusting contour levels interactively, showing multiple isosurfaces for a given map, and restricting display to a zone around selected atoms. The figure shows PDB entry 2fma and its electron density map. Settings are similar to those described in the Density Display tutorial. See also: Chimera volume display guide
(More features...)
 |
Pipes and Planks
The PipesAndPlanks tool shows protein helices as “pipes” (cylinders) and strands as “planks” (rectangular boxes), with connectors for the intervening coil. Adjustable settings include pipe radius, plank width, colors, and whether to include arrowheads to show chain N→C directionality (see image how-to).
(More features...)
B-Factor Coloring
A structure can be colored to show values of an attribute such as atomic B-factor. The image includes a molecular surface that has been clipped and capped, 2D labels, and a color key. Color Zone was used to color the planar cross-section of the surface (see image how-to).
(More features...)
2D Labels and Arrows
Text, symbols, and arrows of multiple colors and sizes can be added to the Chimera display using the 2D Labels tool or the command 2dlabels. These annotations are drawn “in the plane of the screen” in front of any displayed objects and do not move when the objects are moved. 2D labels and arrows are included in saved images and movies, and can be faded in or out over a specified number of frames.
(More features...)
Multiscale Models
The Multiscale Models extension allows Chimera to display large complexes such as virus capsids, ribosomes, and chromatin. It displays the quaternary structure of PDB models and allows subunits to be selected and shown in atomic detail. Matrices are read from PDB files that specify the biological unit. Crystallographic packing can also be shown.
(More features...)
Molecular Graphics
- stick, ball-and-stick, CPK, ribbon, pipe-and-plank, and nucleotide display styles
- molecular surfaces
- highly intuitive rotation, translation, and scaling with the mouse
- Side View for adjusting clipping planes and scaling
- interactive color editing in various color spaces (RGB, CMYK, etc.) with transparency
- ability to save high-resolution images for presentation and publication
- stereo (side-by-side and time-sequential)

Chemical Knowledge
- determination of atom types in arbitrary molecules, including non-standard residues
- ability to add hydrogen atoms
- high-quality hydrogen bond identification
- selection of atoms/bonds by element, atom type, functional group, amino acid category
- interactive bond rotation, distance and angle measurements
(More features...)

Volume Data
Chimera's Volume Viewer displays three-dimensional electron and light microscope data, X-ray density maps, electrostatic potential and other volumetric data. Contour surfaces, meshes and volumetric display styles are provided and thresholds can be changed interactively. Maps can be colored, sliced, segmented, and modifications can be saved. Markers can be placed and structures can be traced. The accompanying image shows a density map of Kelp fly virus from electron microscopy colored radially and with an octant cut out.
(More features...)
Volume Plane Display
Volume data can be shown a single plane (or slab) at a time with the Planes feature in Volume Viewer. Plane display can be set to oscillate along the data X, Y, or Z axis, or the plane location can be specified interactively with a slider.
(More features...)
Topography
Values in a plane of volume data can be shown as heights normal to the plane (a topographic map). When a single plane is displayed with Volume Viewer, the command topography will plot the values as heights in a surface.
(More features...)
Radial Coloring
A surface can be colored radially, that is, by distance from a user-specified point. Additional options include coloring by distance from an axis or a plane. Different coloring schemes can be applied.
(More features...)
Coloring by Density
A surface can be colored by density or other volume data. In the image, the surface is clipped and capped, and only the cap is colored by density. Different coloring schemes can be applied.
(More features...)
Rotamers
Amino acid sidechains adopt different conformational states, or rotamers. Rotamers from the Dunbrack backbone-dependent library or the Richardson "penultimate" library can be viewed, evaluated, and incorporated into structures with the Rotamers tool. A residue can be changed into a different conformation of the same type of amino acid or mutated into a different type. Rotamer torsion angles and library probability values are listed in a dialog, along with (optionally) hydrogen bonds, clashes, and agreement with electron density data. Only rotamers chosen in the list are displayed. When a single rotamer is chosen, it can be incorporated into the structure. The image includes 2D labels.
(More features...)
 |
 |
Metal Geometry
The Metal Geometry tool facilitates analysis of metal-binding sites. It lists potential metal-coordinating atoms (nearby nucleophilic heteroatoms) and suggests likely coordination geometries. An idealized geometry can be depicted with solid arrows, as shown in the figure for the octahedral coordination of Mn++ by six atoms, and the coordination pseudobonds in the structure can be updated to match the chosen geometry.
(More features...)