

|
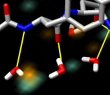
Morphing between the inactive and activated conformations of
the FGFR1 kinase domain. June 9, 2014.
kinase-morph3.mp4
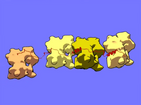
Morphing between the inactive structure (PDB 3C4F, chain A) and the activated structure (PDB 3GQI, chain A) with phosphorylated tyrosines and bound ATP analog. The protein backbone is shown as a tan ribbon. The tyrosine side chains and ATP analog are shown as sticks, with carbon in light blue, oxygen in red, nitrogen in blue, and phosphorus in orange. Created from Chimera session kinase-morph3.py and command file kinase-morph3.com. See also the morphing movie made with ChimeraX (July 2017). |
|
|
Human Brain: Images to Atoms. January 31, 2014. brain_512x512.mp4 (35 Mb) Brain imaging and molecular structures. Created for display on a portable planetarium dome for the 2014 Biophysical Society meeting. Video available on YouTube. |
|
|
Small molecule rotating and casting shadows on a plane.
October 23, 2013.
This simple animation showing interactive shadows was made with the Chimera command script tumble.com. Interactive shadows also work with ribbons and surfaces. |
|
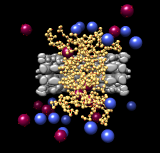
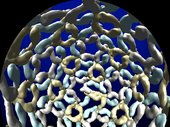
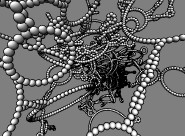
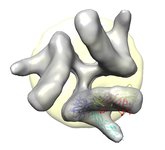
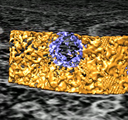
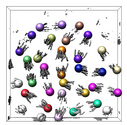
Nuclear pore complex. March 28, 2013. npc.mp4 Brownian dynamics model of transport through the nuclear pore complex. Gray – nuclear pore. Yellow – unstructured FG repeat domains. Red – cargo/transporters. Blue – contaminants. |
|
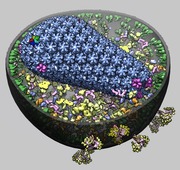
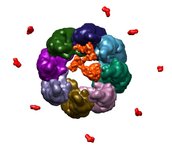
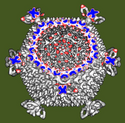
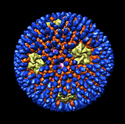
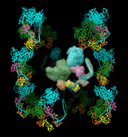
HIV model. March 13, 2013. hiv14h-shadow.mp4 This shows an HIV virus model consisting of a few thousand copies of a dozen different proteins made by Graham Johnson using AutoPack. It shows two broadly neutralizing antibodies bound to HIV spikes and two small molecule inhibitors bound to the virus capsid protein. The movie was made using a Chimera sesssion hiv14h.py. and command script hiv14.cmd. |
|
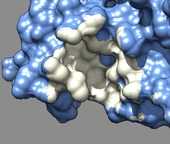
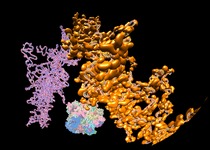
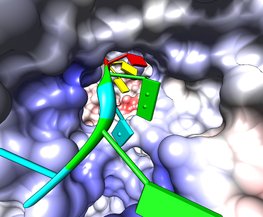
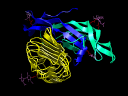
Binding footprint. March 12, 2013. dax1.mp4 Comparison of DAX-1 and a peptide in binding the LRH-1 nuclear receptor (PDB 3f5c and 1yok). The movie was made for Robert Fletterick using a Chimera sesssion dax1.py and command script dax1.cmd. |
|
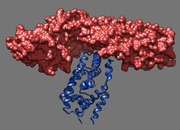
Beta catenin. March 11, 2013. beta-catenin.mp4 Beta catenin is a protein associated with many cancers and binds to nuclear receptors which are transcription factors. This movie shows that a nuclear receptor dimer clashes with beta catenin if docked in the same location where a monomer nuclear receptor binds. The movie was made for Robert Fletterick using a Chimera sesssion beta-catenin3.py and command script beta-catenin.cmd. |
|
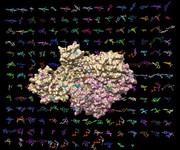
HIV reverse transcriptase drugs. March 6, 2013. hiv_rt_ligands.mp4 Shows 192 small molecules bound to HIV reverse transcriptase including many drugs. These come from 188 molecular structures of reverse transcriptase which were opened in Chimera and aligned with script open_rt_ligands.py. Session file hiv_rt_ligands4.py and command file hiv_rt_ligands4.cmd produced the movie. |
|
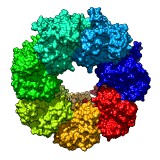
Wobble motion. November 19, 2012. precess.mp4 Demonstration of the precession option of the turn command, showing GroEL 7 protein ring (PDB 1GRL). This animation was made with command "turn z 2 360 precess 20". |
|
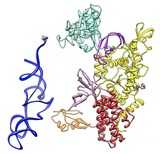
Leucyl-tRNA synthetase. June 28, 2012. leucyl-tRNA.mov Andres Palencia shows how leucine is attached to a transfer RNA. The movie was made with Chimera command script leucyl-tRNA.cmd. Structural dynamics of the aminoacylation and proofreading functional cycle of bacterial leucyl-tRNA synthetase. |
|
HIV RNA. February 22, 2012. hiv_half_dome.mov Animation of molecular machinery that copies the HIV virus RNA genome with music and narration, created for display on a planetarium dome at the 2012 Biophysical Society meeting. More details. More resolutions on YouTube. |
|
Dome animation. November 3, 2011. dome-small.mov (17 Mb) dome.mov (97 Mb) dome.avi (96 Mb) Three short animation segments for display on a dome projection system: dengue virus capsid maturation, bacteriophage phi6 electron microscopy, and RNA polymerase fly-through. |
|
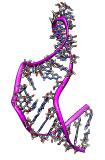
HIV RNA secondary structure. May 20, 2011. hivrna.mov (9 Mb) HIV-1 RNA secondary structure using data from Watts et al., "Architecture and secondary structure of an entire HIV-1 RNA genome" Nature. 2009 Aug 6;460(7256):711-6. |
|
Rotavirus polymerase fly-through. March 10, 2011. rotafly.mov (3 Mb) Fly along the RNA being copied by rotavirus RNA polymerase (PDB 2r7r) an enzyme that replicates the 11 segments of viral RNA. The blue and red polymerase coloring is Coulomb electrostatic potential. The fly-through follows a slightly weaving path to avoid crashing through the RNA bases. The fly command produces a cubic spline trajectory through 4 hand-chosen positions. A video shows all the steps to make this animation. A Chimera session file rotafly.py and a command file rotafly.cmd containing the movie recording and fly command can be used to recreate the movie or variations on it. |
|
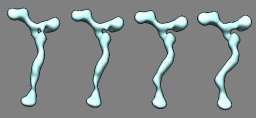
Nup84 nuclear pore subassembly. March 9, 2011. nup84.mov (2 Mb) Morph between density maps for straight stem and kinked stem conformations of a 7 protein nuclear pore subassembly (EMDB 5151, 5152) created with the Morph Map tool. A video shows the steps used to produce this animation. |
|
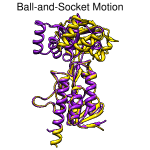
Ball-and-socket motion. August 26, 2010. trmovie.mov (5.5 Mb) [see also on YouTube] The "ball-and-socket" conformational change in thioredoxin reductase upon binding NADPH, shown by superimposing 1tde chain A (complex with FAD) and 1f6m chain A (complex with FAD and NADP+ analog), then morphing from one structure to the other. The Chimera command file trmovie.com performs all setup, calculations, and movie-recording. Chimera command files are plain text, and simply opening the file in Chimera will execute its contents. To run this script without recording (which makes execution slow), first insert # before each of the five "movie" commands. |
|
Herpes virus slices. January 27, 2010. orthoslice.mov (3 Mb) Slicing a virus density map (EMDB 1306) while showing 3 orthogonal planes created with Chimera command script orthoslice.cmd. Alternatively a Python script orthoslice.py can be used to handle maps of any size. Python scripts provide use of variables, loops, and Chimera data structures. Command scripts and Python scripts are run with File / Open.... |
|
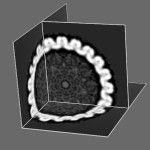
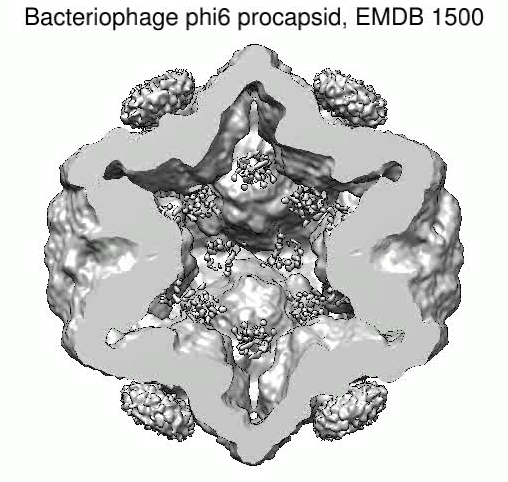
Bacteriophage phi6. December 4, 2009. mapmovie.mov (3 Mb) Simple movie spinning and slicing a virus density map (EMDB 1500) created with Chimera command script mapmovie.cmd. |
|
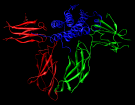
HIV spikes. November 13, 2009. gp120.mov (12 Mb) Shows rotation of HIV spike protein gp120 on binding of CD4 and FAB 17b suggested by electron microscopy reconstructions (EMDB 5019, 5020, 5022, 5023) combined with crystallography (PDB 1gc1). It was created with a Chimera command script and a session file and maps gp120.zip. |
|
Termite gut. September 22, 2009. termitegut2.mov (17 Mb) Highlights bacteria in termite hind gut that degrade lignocellulose (wood) as seen by scanning electron microscopy. Layers 15 nm thick were shaved off by a focussed ion beam to produce the stack of images. Data set is 6 by 18 by 3 microns, provided by Manfred Auer. |
|
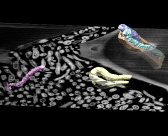
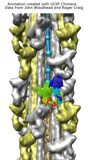
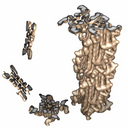
Archeal chaperonin from Methanococcus marapaludis. March 12, 2009. mmcpn.mov (11 Mb) This movie shows how Mm-cpn, a chaperone, binds a partially-unfolded protein and helps it to fold to its native conformation. Three data sources form the basis for the animation: 1) atomic structures from X-ray crystallography, 2) density maps of Mm-cpn in closed and open states from cryo-EM, and 3) order of binding and unbinding events from biochemical experiments. The dynamics illustrated are loosely based on interpolation, Brownian diffusion, and molecular dynamics. The animation was created as an illustration rather than a portrayal of the exact mechanisms, about which much is still unknown. Created by Greg Pintilie. |
|
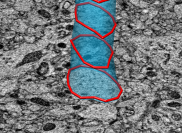
Nuclear pores. January 23, 2009. flypores.mov (9 Mb) Fly-by of 3 nuclear pores in a human T-cell seen in electron tomography using the fly command to smoothly transition between 4 saved view points. The fly command was added to Chimera 1.4 in January 2009. |
|
Rat brain electron microscopy. November 13, 2008. rb.mov (25 Mb) rb.avi (25 Mb) Shows 50 x 50 x 100 micron volume of rat cortex imaged by serial block-face scanning electron microscopy (details). Illustrates the challenge of segmenting neural connections. |
|
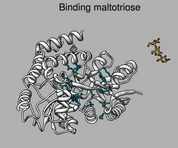
Ligand binding and conformational change. July 28, 2008. mbp.mov (15 Mb) Shows maltotriose binding protein (2gha) binding site, hydrogen bonds, nearby aromatic residues, and conformational change between bound and unbound states. A Chimera 1.4 command script mbp.cmd to make this movie is given in the 2009 movie making tutorial. |
|
Flexibility of an NMR ensemble. June 23, 2008. 1r7w.mov (12 Mb) Shows morphing between the 20 conformations of an NMR ensemble of a stem loop RNA (1r7w) that allow ribosomes to translate viral mRNA without the normally required methylguanosine mRNA cap. |
|
Combinatorial scanning of human growth hormone. November 22, 2006. 3hhr-scan.mov (33 Mb) Illustrates results from quantitative scanning mutagenesis of human growth hormone (hGH) to probe the hormone-receptor binding interface, described in Pal et al., J Biol Chem 281:22378 (2006). The movie was created with the Chimera command script 3hhr-scan.com (after removing ## from movie-recording commands), which in turn opens the file of scanning results 3hhr-scan.txt. |
|
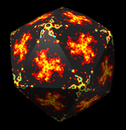
Sliced virus density map. October 5, 2006. em_1ynv_cut.mov (18 Mb) Electron microscopy reconstruction of sulfolobus turretted icosahedral virus sliced perpendicular to a 5-fold symmetry axis. Low, medium and high density are shown in red, white and blue on the cut surface. The density map was from VIPERdb. |
|
Traced chromosome arms. August 24, 2006. arms.mov (7 Mb) Traced chromosome arms during Drosophila cell division. The chromatin was labeled with a histone-GFP fusion protein. The time between frames is 10 seconds. Data courtesy of Yuri Strukov. |
|
Cell division. August 4, 2006. mitosis.mov (10 Mb) 3d optical miscroscopy time series showing dividing cells. This is an early, 2 hour old, Drosophila melanogaster embryo, in which chromatin is labeled with histone-GFP fusion protein. Frames were taken every 10 seconds. Thanks to Yuri Strukov for providing the data. |
|
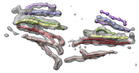
Myosin thick filament analysis. June 16, 2006. myomovie.mov (30 Mb) Shows symmetry, fitting, and segmenting a myosin thick filament density map. Thanks to John Woodhead and Roger Craig for providing the map. A very similar movie was made in 2011, with minor updates in 2014, using command script myomovie.cmd. The script, data files, and movie are included in myomovie.zip (see also on YouTube). |
|
Actin filament nucleation. April 24, 2006. spire.mov (6 Mb) Actin filament nucleated by Spir protein. This animation was created by Janet Iwasa based on work done by Margot Quinlan. It was made in Macromedia Flash using an actin monomer model exported from Chimera. More of Janet's animations and illustrations are at www.onemicron.com. |
|
Myosin thick filament. February 17, 2006. myosin_slabs.mov (20 Mb) Cross-section slabs of a myosin thick filament cryo-EM density map. The map comes from John Woodhead and Roger Craig, and is described in Nature. 2005 Aug 25;436(7054):1195-9. |
|
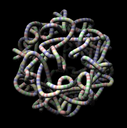
Satellite Tobacco Mosaic Virus Genome. February 1, 2006. stmv-rna.mov (7 Mb). Organization of the satellite tobacco mosaic virus genome. Single strand RNA, 1058 nucleotides, depicted as a tube with A, C, G, U shown in red, yellow, green, and blue. |
|
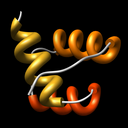
Engrailed Homeodomain. January 20, 2006. enh.mov (3 Mb). Folding of the engrailed homeodomain, PDB 1enh. The trajectory was created by Christophe Guilbert using the flexible docking program MORDOR. |
|
Orthoreovirus. January 5, 2006. reovirus.mov (12 Mb). Successive layers of orthoreovirus capsid fly away radially. The original version of this movie was created by Xing Zhang in Tim Baker's lab using other software. The PDB model is 2cse. |
|
Beta hairpin. November 30, 2005. hairpin.mov (40 Mb). Simulation of the C-terminal beta hairpin from protein G using AMBER shows water occupancy and hydrogen bonds between the hairpin and water molecules. Data provided by John Chodera. More details appear in the Chimera image gallery entry. |
|
Myosin thick filament. October 5, 2005. myosin.mov (8 Mb). Shows 12 pairs of myosin heads arranged helically as in a thick filament. One pair is being moved around interactively and the others move to preserve the helical symmetry. Automatically maintaining symmetry is useful for interactive fitting of molecules into symmetric density maps. The PDB model is 1i84. |
|
Follicle stimulating hormone. October 3, 2005. hrc_demo.mov (43 Mb). Overview of follicle stimulating hormone and its receptor. This movie was captured by playing the Hormone-Receptor Complex demonstration which is included with Chimera (under menu Tools / Demos). The PDB model is 1xwd. |
|
Rice Dwarf Virus. September 23, 2005. ricedwarf.mov (6 Mb). Concentric shells of a rice dwarf virus density map are shown. Low densities are shown in red, high in blue. A shell that is interpolated in shape between an icosahedron and a sphere is used. The shell radius is shown in angstroms in the lower left corner. The data is EM Databank entry 1060. |