
 Volume Path Tracer allows markers to be placed manually within
volume data, labeled, and connected by smooth, interpolated paths.
In this context, it is used together with
Volume Viewer.
Markers can also be placed, moved, and connected in arbitrary ways
to build conceptual models independent of any volume data.
Volume Path Tracer allows markers to be placed manually within
volume data, labeled, and connected by smooth, interpolated paths.
In this context, it is used together with
Volume Viewer.
Markers can also be placed, moved, and connected in arbitrary ways
to build conceptual models independent of any volume data.
This tool was initially designed to trace fluorescently labeled chromosomes in light microscope data and protein backbones in cryoelectron microscope density maps.
There are several ways to start Volume Path Tracer, a tool in the Volumes category.
Components of the basic panel (those shown regardless of subpanel status) will be described first.
| Volume Path Tracer Panel - basic components |
|---|
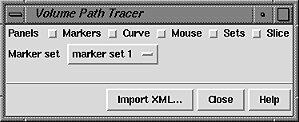 |
Import XML... brings up a dialog for opening files of markers previously saved with Export XML in the Sets panel. Help brings up this manual page in a browser window, and Close dismisses the Volume Path Tracer Panel. If the panel is closed or hidden accidentally, it can be reopened in the same state by reinvoking Volume Path Tracer.
Markers are implemented as atoms that belong to a molecule, or marker set. Currently, the markers in each set are part of residue 1 and are named m1, m2, and so on. They are normally shown using a sphere representation. Just like other atoms in Chimera, markers can be selected and their properties can be inspected and modified.
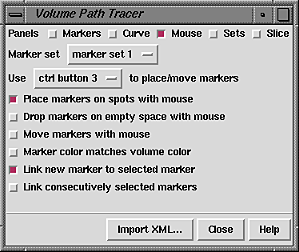
The Use [button] to place/move markers setting in the Mouse panel controls which mouse button will perform marker operations, here called the assigned button. The assigned button will cease to perform any previously assigned function.
| Volume Path Tracer - Mouse Panel |
|---|
 |
A new marker is always added to the active marker set.
When the Place markers on spots... mode is activated in the Mouse panel, clicking the assigned button on a spot in the current set of data shown by Volume Viewer creates and places a marker. The marker is placed at the (X,Y) position of the cursor at the time of the mouse click, at the depth (Z-coordinate) of the closest local maximum above the detection threshold. If no value along the line of sight exceeds the threshold, no marker is created. A slice line or slice graph can be helpful for viewing the data values along the line of sight.
Note that a marker cannot be placed on a data minimum automatically (as might be useful for signed data); a marker must first be created and then manually moved to overlay a minimum.
When the Drop markers on empty space... mode is activated in the Mouse panel, clicking the assigned button will create a marker in empty space. When both Place markers on spots... and Drop markers on empty space... modes are turned on and the assigned button is clicked, there is first an attempt to place the marker on a data spot above the detection threshold; if no such spot exists, a marker will be created in empty space. When a marker is placed in empty space, its Z-coordinate (depth) is determined as follows:
When a marker is created, it is selected and any other markers are deselected. Markers can also be selected manually, just like other atoms in Chimera.
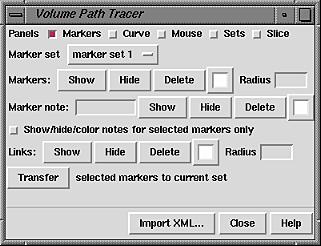
In the Markers panel, the Markers: button Delete deletes any selected markers. Markers from a different set can be transferred to the active set by selecting them and then using Transfer selected markers to current set. The Markers: buttons Show and Hide display and undisplay all markers in the active set.
When the Move markers... mode is activated in the Mouse panel, a marker can be dragged from one (X,Y) position to another with the assigned button. Dragging with both the assigned button and the Shift key held down changes the Z-coordinate of the marker; dragging down pulls the marker closer (out of the screen) while dragging up pushes the marker further away (into the screen). The Shift key can be pressed and released repeatedly during a single dragging motion with the assigned button to switch between (X,Y) and Z-coordinate movment. It is difficult to see marker depth without using stereo, although the Side View may be helpful.
If any marker creation mode is also activated, the result of clicking the assigned button depends on the location of the click. If the click is over an existing marker, movement will be enabled; if the click is not over an existing marker, a new marker will be created.
Only one marker can be moved at a time. A marker cannot be grabbed if there is another selectable item (such as an atom, bond, or another marker) in front of it. This problem will not arise with the volume data displays created by Volume Viewer (Surface, Mesh, or Solid rendering mode) since they are not selectable.
A newly created marker can also be moved in what was the Z-dimension at the time of its creation by dragging the vertical line in the slice graph.
Marker color and radius can be set in the Markers: section of the Markers panel.
| Volume Path Tracer - Markers Panel |
|---|
 |
If the marker Radius field is left blank:
The number of subdivisions used for drawing the spheres cannot be controlled. Radii much less than 1.0 result in bumpy spheres drawn with a very small number of triangles, while radii much larger than 1.0 cause a large number of triangles to be used and may degrade interactive performance.
Labels can be added to markers using the Markers panel. Entering text in the Marker note: field and pressing the return key attaches the text to each currently selected marker. Notes are implemented as atom labels on their respective markers (which are implemented as atoms). Also in the Marker note: section, Delete removes notes from any markers that are selected, while Show, Hide, and changing the color well color:
The font size of the notes cannot be changed, and notes cannot occupy multiple lines.
Lines drawn between markers are called links. Links are implemented as bonds. Just like other bonds in Chimera, they can be selected and their properties can be inspected and modified.
When the Link new marker to selected marker mode is activated in the Mouse panel, a newly placed marker will be connected to the currently selected marker. One (and only one) marker must have been selected beforehand to produce the link. When a new marker is placed, it is automatically selected and any other markers are deselected. This facilitates placing a chain of linked markers. Similarly, the new link is selected, while other links are deselected. Links can also be selected manually, just like other bonds in Chimera.
Links between existing markers can be created when the Link consecutively selected markers mode is activated in the Mouse panel. In this mode, when an individual marker is selected, it is linked to the previously selected marker, which is then deselected. Only one marker should be selected at a time. This is convenient for creating linear chains of markers, but inconvenient for making spokes radiating from a single marker. Only one link can exist for a given pair of markers.
In the Markers panel, the Links: button Delete deletes any selected links. The Links: buttons Show and Hide display and undisplay all links in the active marker set.
Link color and radius can be set in the Links: section of the Markers panel. Editing the color in the color well changes the color of any currently selected links and subsequently created links. Links can be shown as lines or cylinders, corresponding to the Bond draw modes Wire and Stick. If its radius is zero, the link is shown as a line; otherwise, the link is shown as a cylinder with the specified radius. When the link Radius field is left blank, the cylinder radius is half the default marker radius. Entering a value in the Radius field (with or without pressing the return key) sets the radii of subsequently created links. When the return key is pressed, the radii of any selected links are changed accordingly.
A marker set is a named collection of markers and links, implemented in Chimera as a molecule model. Marker sets are listed by name in the Sets panel.
| Volume Path Tracer - Sets Panel |
|---|
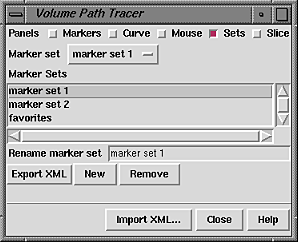 |
Although only one set at a time can be the active set, multiple marker sets can be chosen from the Marker Sets listing by dragging with the mouse or Ctrl-clicking to toggle individual entries. Remove and Export XML... save selected marker sets as... act upon all chosen sets, or if none are chosen, the active set. A marker set cannot be recovered after it has been removed.
New starts a new marker set and makes it the active set. New marker sets are initially named marker set 2, marker set 3, and so on. The name of the active set can be changed in the Rename marker set field.
<marker_set name="marker set 1">
<marker id="1" x="-6.1267" y="17.44" z="-3.1338"  radius="0.35217"/>
<marker id="2" x="1.5395" y="16.277" z="-3.0339" r="0" g="1" b="1"
               radius="0.5" note="An example note"/>
<link id1="2" id2="1" r="1" g="1" b="0" radius="0.17609"/>
</marker_set>
The r, g, and b attributes are red, green, and blue color components, respectively, with possible values ranging from 0 to 1.
Extra attributes can be present within the marker, link, and marker_set tags. While these are not used by Volume Path Tracer, they provide a mechanism for retaining information from or passing information to other programs. For example,
<marker id="3" x="3.23" y="4.34" z="5.45" r="0" g="0" b="1" radius=".4"
 note="105" somethingextra="hoola hoop"/>
<link id1="1" id2="2" r="0" g="1" b="0" radius=".2" leprechaun="gold"/>
shows the extra attributes somethingextra and leprechaun. Extra attributes included in an input file are retained and included in files written back out with Export XML.
WARNING: The file format for saving marker sets is likely to change in future releases. These changes may be incompatible with the current format.
Linked chains of markers can be fit with smooth curves using the Curve panel.
| Volume Path Tracer - Curve Panel |
|---|
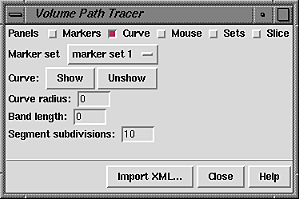 |
Various curve parameters are set within the Curve panel. Currently, it is necessary to press Show for any changes in parameters to take effect. The curve is rendered as a line when the Curve radius is zero, and as a tube consisting of a series of cylinders when the Curve radius is greater than zero. Consecutive cylinders are joined by spheres. Neither marker radii nor link radii affect the tube radius. Segment subdivisions refers to the number of subdivisions used to draw the curve segment between each pair of linked markers.
Curve coloring is based on marker and link colors. Band length specifies the length of curve centered on each marker that should be colored the same as the marker. Parts of the curve further away from a marker receive the color of the corresponding link. Color bands are not always exactly the right length, because:
Slice graphs are data profiles along the line of sight (the Z dimension) at the time of marker creation, as shown below for 3-component volume data.
| Volume Path Tracer - Slice Panel |
|---|
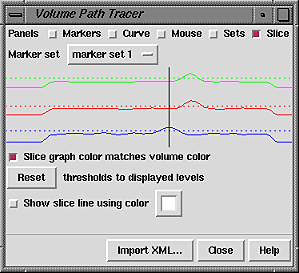 |
There is a solid line and a dotted line for each data component. The solid line represents the data values in the Z dimension, and the dotted line is the detection threshold for placing markers. The marker is placed at the closest local maximum exceeding the threshold; a vertical line shows where the marker has been placed (its Z-coordinate). If no value along the line of sight exceeds the threshold, no marker is created. The vertical line can be dragged to move the marker to a different depth. This is useful when a marker has been placed on a faint foreground spot rather than its intended destination, a brighter background spot.
The detection threshold is initially the same as the display threshold set in Volume Viewer. If multiple display thresholds are being used, the detection threshold is set to the one at the lowest data value (note that this could be a negative number). The detection threshold can be moved higher or lower with the mouse as needed when the automatic setting is not appropriate. This does not change the display threshold. Once a detection threshold has been moved, it is shown with longer dashes. Reset sets the detection threshold(s) back to the existing display threshold(s).
When Show slice line... in the Slice panel is active, creating a marker within the volume data box generates a line along the current Z axis that intersects the marker. If there is no volume data, no slice line is generated. Because the line follows the line of sight at the time of marker creation, it will not be visible until there has been some rotation. Upon rotation, it should be evident which data spots the line intercepts and whether the marker has been placed on the intended spot. The slice line will disappear when a newer marker is created, and if the newer marker is within the volume data box, a slice line will be drawn for the newer marker.
Changing the color in the Show slice line... color well does not affect the current slice line, only those subsequently drawn. Slice lines are implemented as VRML models.