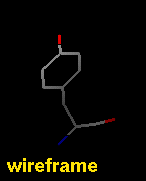
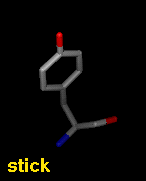
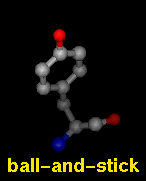
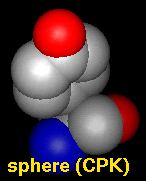
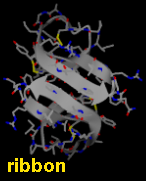
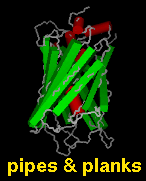
Several types of molecular representation are available in Chimera, and more than one type can be present in a single display. The default representation is a simple line or wireframe drawing in which atoms are shown as dots and bonds as wires. Further options are stick with "endcap" atoms and stick bonds, ball-and-stick with ball (small sphere) atoms and stick bonds, and sphere with sphere (full VDW radius) atoms and stick bonds. The sphere representation is also called a Corey-Pauling-Koltun (CPK) model. In addition, proteins and nucleic acids can be drawn as a ribbon, and proteins with PDB secondary structure records can be drawn as "pipes and planks."
The bond linewidth in the wire representation is a model attribute; that is, different parts of a single model cannot have different linewidths (although they can be in different, non-wire representation types). Wire, stick, ball-and-stick, and CPK representations are attributes of the individual atoms and bonds (see also draw mode). The secondary structure ribbon is an attribute at the residue level. The pipes-and-planks representation is not an attribute but a separately constructed VRML object. Finally, how pseudobonds are drawn are pseudobond group attributes.
There are several ways to change or add representations:
Molecular surfaces can be created, displayed, and manipulated in real time. A surface is calculated and displayed using the Surface section of the Actions menu or the command surface.
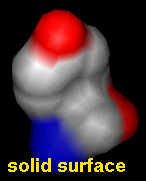
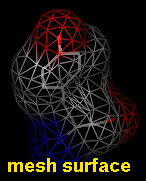
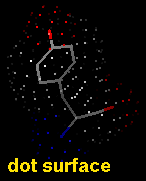
The surface representation can be switched among solid, mesh, and dot using:
Note that molecular surfaces produced by Chimera are created with embedded software from the MSMS package by Prof. Michel Sanner, described in:
"Reduced surface: an efficient way to compute molecular surfaces," M.F. Sanner, A. J. Olson, and J.C. Spehner, Biopolymers 38, 305 (1996).
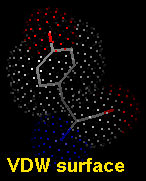
A VDW dot surface can be displayed with the command vdw and its density adjusted with vdwdensity (density=5 in the example below).
|
|
Finally, isosurfaces (contour surfaces) for three-dimensional numerical data sets can be displayed with Volume Viewer and DelPhiViewer.