MD Movie 
MD Movie is a tool for viewing and analysis of trajectories
and other ensembles.
For examples of use, see the
Trajectory and
Ensemble Analysis tutorial. See also:
Morph Conformations,
Molecular Dynamics Simulation,
coordset
There are several ways to start
MD Movie, a tool in the MD/Ensemble Analysis category.
Several formats are supported:
| Format |
Required Inputs |
|---|
| Amber |
- prmtop (parameter/topology) file, either the
older or the newer format (see Appendix E of the
Amber 7 Manual)
- trajectory (coordinates), either
formatted or
Amber NetCDF, which is binary.
Multiple trajectory files can be specified,
to be concatenated in the order given. Additional trajectory files
can be loaded at a later stage.
Amber residue names are remapped to standard PDB residue names where possible.
Partial charges are assigned as the atom
attribute
named charge.
Amber NetCDF support is courtesy of Mingfeng Yang.
|
|
CHARMM,
NAMD (PSF/DCD), or
X-PLOR |
- PSF (protein structure file; X-PLOR-style topology)
- DCD (binary trajectory). Multiple DCD files can be specified,
to be concatenated in the order given. Additional DCD files
can be loaded at a later stage.
Partial charges are assigned as the atom
attribute
named charge, and segment names as the residue
attribute
named segment.
PSF/DCD support is courtesy of
MDTools.
|
|
NAMD (prmtop/DCD)
|
- prmtop (AMBER-style parameter/topology file)
- DCD (binary trajectory). Multiple DCD files can be specified,
to be concatenated in the order given. Additional DCD files
can be loaded at a later stage.
Partial charges are assigned as the atom
attribute
named charge. DCD support is courtesy of
MDTools.
|
|
GROMACS |
XTC/TRR support is courtesy of the
XTC Library.
|
|
GROMOS |
- topology
- coordinates (trajectory)
- PROMD (PROMD input file used to generate the trajectory)
- a scale factor to convert the coordinates to angstroms (usually 10.0)
|
|
MMTK
|
|
|
particle
|
|
PDB, single file
(coordinates for each frame bracketed
by MODEL and ENDMDL records) |
The name of the file must be supplied.
The MODEL numbers are interpreted as frame numbers
and should start with 1 or 0 and increment by 1.
|
PDB, multiple files
(one file per frame) |
Starting and ending file names must be supplied.
The file names must include frame numbers, and the frames
will be ordered by increasing number
(not necessarily consecutive; missing numbers will be ignored).
The files must not contain END records.
|
XYZ
(multiple files, one per frame) |
Starting and ending file names must be supplied.
The file names must include frame numbers, and the frames
will be ordered by increasing number
(not necessarily consecutive; missing numbers will be ignored).
|
These input files can be gzipped.
The PDB options generally require coordinates for the same set of atoms to be
supplied for each frame. However, if the coordinates supplied for a
frame represent only a subset of the atoms in the preceding frame,
it will be inferred that the remaining atoms are present but have the
same coordinates as in the preceding frame. Changes are cumulated
in the forward direction and based on all frames, even when frames
are skipped during playback (step size > 1).
All or a contiguous subsegment of a trajectory can be loaded.
If pipe is entered as the ending frame number,
the input trajectory will be read until it runs out,
as long as no other input specifies a smaller ending frame number.
For example, for a GROMOS trajectory,
the NSTLIM variable in the PROMD file should also be increased to at least
the total number of frames expected. When a pipe has been specified,
there will be an attempt to load the entire trajectory up front.
A further option is a metafile,
simply a text file that specifies the input files/parameters.
The first line designates trajectory type
(where case is unimportant but any spaces should be stripped, for example,
namd(prmtop/dcd) or gromos),
and optionally, starting and ending frame numbers of the range to be loaded.
A pipe can be specified as described above.
If no frame numbers are supplied, the entire trajectory will be loaded;
however, if "?" is given for both the starting and ending frame numbers,
a dialog for entering this information will appear.
The remaining lines specify input files and
parameters in the same order as in the dialog. For example:
amber 500 1000
dna.prmtop
dna.mdcrd
or:
pdb
single
108d.pdb
If input files are not in the same directory as the metafile,
their absolute pathnames or pathnames relative to the location of the metafile
should be supplied.
A metafile can be opened directly from the
Command Line
(or the system command line upon
startup) using the prefix md: or movie:. This will
start MD Movie and open the trajectory data.
VIEWING FRAMES
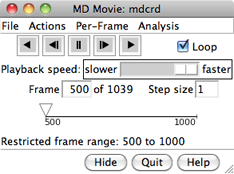
After input files and parameters have been specified,
the first set of coordinates will be displayed and
the MD Movie controller will appear:
If a subsegment was specified, a message about the
restricted frame range will be displayed temporarily.
The total number of frames in the trajectory (whether loaded or not)
will continue to be reported.
For all input formats except PDB and XYZ,
the coordinates for a given frame are not read in
until that frame is viewed or used for analysis.
From left to right, the buttons mean: play backward continuously;
go back one step; stop;
go forward one step;
and play forward continuously. When the Loop
option is on, forward play can wrap from the end to the beginning
of the loaded trajectory and reverse play can wrap from the beginning
to the end.
The rate of continuous play can be adjusted
with the Playback speed slider; up to a 1-second delay
can be added between frame advances. When continuous play is not in use,
the display can also be controlled by moving the pointer (inverted triangle)
on the timeline or by entering a new Frame number.
The Step size
controls the level of sampling for continuous playback. For example,
a step size of 3 indicates that only every third frame will be shown;
however, when forward play loops from end to beginning, the movie will
start at the first frame loaded, and when reverse play loops from beginning
to end, the movie will start at the last frame loaded.
Frame number and step size changes take effect when
return (Enter) is pressed.
Frames can also be navigated by moving the black vertical line on a
distance or angle plot or by using the command
coordset.
Pausing any continuous playback with the dialog is recommended
before using these other methods.
** Protein secondary structure assignments are not recomputed automatically
over the course of a trajectory. If displaying protein as a
ribbon,
see the note below. **
The current frame or all frames that have been viewed
can be saved as a PDB file with
File... Save PDB.
The view can be held steady on
selected atoms.
One can define scripts
to be executed at each frame update.
A complete menu listing with short descriptions is included
below.
Hide closes the interface without exiting from MD Movie;
the interface can be reopened using the Tools menu entry
for the instance
of MD Movie. Quit exits from MD Movie and
removes the structure from the Chimera window.
Help opens this manual page in a browser window.
RECORDING A MOVIE
Images can be captured during
trajectory playback and automatically assembled into a movie file.
Manipulations in Chimera can be performed and
per-frame scripts executed
during the playback/image-saving process.
See also:
coordset,
making movies
File... Record movie
opens an interface for specifying image capture and movie assembly
parameters:
- File name - name for the resulting movie file
- File type (movie format) choices:
- H.264 [.mp4]
- VP8/WebM [.webm]
- Theora [.ogv]
- Quicktime [.mov]
- AVI MSMPEG-4v2 [.avi]
- MPEG-4 [.mp4]
- MPEG-2 [.mpg]
- MPEG-1 [.mpg]
- WMV2 [.wmv]
- APNG [.png] - animated PNG
(lossless, settings for quality and
bitrate
do not apply)
- Starting frame (first frame loaded, by default)
- number of the first frame at which to save an image
- Step size [n]
- level of sampling within the indicated range
(every nth frame will be used)
- Ending frame (last frame loaded, by default)
- number of the last frame to possibly include (if not skipped by sampling);
must be within the range originally loaded
- Encode forward then backward ("roundtrip") (true/false)
- whether to include the frames in reverse order as the second half
of the movie
- Rendering:
- Chimera (default)
- Chimera rendering, normally offscreen
(details...).
Images can be supersampled, that is, initially generated at a
higher resolution and then sampled down to the final size.
- Supersample (1x1/2x2/3x3/4x4)
- how many pixels to sample in the X and Y dimensions for each pixel in
the final saved image; thus, 1x1 corresponds to no supersampling.
Higher values increase the smoothness of edges in saved images and
increase calculation time with little effect on file size.
3x3 is generally recommended when supersampling is done.
- POV-Ray
- raytrace with POV-Ray.
This rendering option is the slowest but includes fancier effects
such as high-quality shadows.
The POV-Ray Options button opens the corresponding
preferences.
Advanced Options:
- Quality (highest/higher/high/good/medium/fair/low)
- higher quality corresponds to higher (variable) playback bit rates and
a larger movie file, assuming the same window size and movie frame rate
- Image format - image file format
(however, PNG will be used regardless of this setting if
raytracing is done):
- JPEG [.jpeg]
- PNG [.jpeg]
- PPM [.jpeg] (default)
- Additional recording options
- options are the same as for the command
movie
record
(include only the options, e.g. directory ~/Desktop/images,
not the movie record part);
if this field is left blank, image frames will be saved
with default names in a default location
(but normally deleted after movie encoding, depending on the encoding options)
- Additional encoding options
- options are the same as for the command
movie
encode
(include only the options, e.g. resetMode keep,
not the movie encode part);
if this field is left blank,
the movie will be encoded to play at 25 frames per second,
and image frames will be deleted after the movie has been encoded
Clicking Record plays the trajectory and saves image frames
according to the specified starting and ending points and step values.
The series of images is encoded as a movie file. One duplicate image
is included at the end to avoid a “motion blur”
at the end of the movie. Stopping playback with the
MD Movie controller in the middle of the
playback/image-saving process will abort recording without
generating a movie file.
Close closes the dialog without initiating recording.
Image Tips shows the tips
on preparing images, and
Help opens this manual page in a browser window.
PER-FRAME SCRIPTS
Per-Frame... Define script allows
specification of a script to be executed at each trajectory frame.
Scripts can be written in Chimera commands or Python code, and can
incorporate trajectory frame numbers.
Python scripts can also access the molecule model instance.
Examples:
- the following Chimera command script
(eachFrame.com)
identifies hydrogen bonds at each frame and shows only the residues involved:
chain @ca
~disp solvent
hb line 2 color yellow reveal true
Commands to be executed only at a specific frame can be indicated
with a leading #frame_num: (for example, #50:)
that will be stripped before the command is executed.
- the following Python script
(specificFrames.py)
initiates events at specific frames:
from chimera import runCommand
frame = mdInfo['frame']
if frame == mdInfo['startFrame']:
        runCommand("roll y 3 40")
elif frame == 10:
        runCommand("color green")
elif frame == 50:
        runCommand("color orange")
        runCommand("rl :ala; color dodger blue :ala; rep stick :ala")
elif frame == 90:
        runCommand("~rl; rep wire :ala")
else:
        runCommand("color byhet")
For Python scripts, the chimera module is automatically imported.
Note:
Frame arguments in commands such as
roll refer to
image frames rather than to unique data (trajectory) frames.
For a one-to-one correspondence between image and trajectory frames,
the Playback speed slider must be positioned
all the way to the right and the viewing step size set to 1.
Whereas an MD Movie per-frame script executes at each trajectory frame,
commands to be executed at each image frame (independent of any trajectory)
can be specified with the
perframe command.
The rate at which Chimera draws image frames can be controlled with
set
maxFrameRate.
Insert text file allows browsing to a text file and placing its contents
in the script area. Save to file saves the current contents of
the script area to a text file.
OK and Apply execute the script with and without
closing the dialog, respectively. If the movie is playing, the
script will continue to be executed for each trajectory frame until
Stop running script is chosen;
if the movie is halted on a single frame, the script will be executed
for that frame and will not be executed again until a different frame is shown.
Clear deletes the contents of the script area. Close
closes the dialog without executing the script, and Help opens
this manual page in a browser window.
PLOTTING
Analysis... Plot allows plotting values
of structure measurements versus frame number:
- Distances
- Angles (each defined by three atoms, not necessarily bonded)
- Dihedrals (each defined by four atoms, not necessarily bonded)
- RMSD
(root-mean-square deviation of specified atoms relative to a reference frame)
For distances and angles, the appropriate number of atoms
(two, three, or four) should be
selected.
RMSD calculations require specifying the atoms of interest and
the reference frame number.
As in all-by-all RMSD analysis, least-squares-fit RMSD
values are calculated without applying any transformation.
The atoms can be specified by
selection
(where lack of selection indicates all atoms) in combination with the options:
- Ignore solvent and non-metal ions (true/false)
- whether to ignore
solvent residues
and monatomic anions (Cl–, Br‐, etc.)
- Ignore hydrogens (true/false)
- Ignore metal ions (alkali/true/false)
- whether to ignore alkali metal ions (Li+, Na+,
K+, etc.), or all metal ions (if true),
or none (if false, thus including any metal ions)
Clicking Plot plots the measurement value versus trajectory frame number.
If frames have not yet been viewed/loaded, a dialog will appear with
the choices: load all frames (in the range specified in the initial input),
load every nth frame, or simply wait until a frame is viewed
to load it. Loading via this dialog is faster than viewing/playing the whole
trajectory. If not all frames are loaded at this point, the plot will be
filled in with additional values as the trajectory is viewed.
All measurements of the same type (for example, distances) are placed in
a single plot. The measurements are listed in a table to the right
of the plot, with columns:
- line color
(a color well)
- whether Shown on the plot
- measurement value at the current frame
- for distances/angles: names of the atoms defining the measurement
- for RMSDs: reference frame and
number of atoms (per frame) used in the calculation
One or more rows (measurements) can be chosen in the table by clicking
and dragging; the corresponding atoms will be
selected.
Ctrl-click toggles the status of a single row.
Clicking Delete removes the chosen measurements from the
table and plot.
Plots can be hidden individually using the
 button above the table
or collectively by closing the dialog window. In either case,
the plots have not been deleted and can be shown again using the
MD Movie Analysis... Plot menu.
button above the table
or collectively by closing the dialog window. In either case,
the plots have not been deleted and can be shown again using the
MD Movie Analysis... Plot menu.
The current frame is indicated with a vertical black line on the plot.
Clicking elsewhere on the plot will reposition the line and
jump to the corresponding frame, and playback can be controlled directly
by dragging the line. Pausing any continuous playback
is recommended to facilitate such manual control over frame viewing.
Below each plot are standard
plot navigation icons
provided by matplotlib. Images saved via the icon
 will not include the vertical black line.
The Dump Values button at the bottom of the dialog allows
saving measurements to a text file, using the number of decimal places
specified in Structure
Measurements.
will not include the vertical black line.
The Dump Values button at the bottom of the dialog allows
saving measurements to a text file, using the number of decimal places
specified in Structure
Measurements.
OCCUPANCY ANALYSIS
It may be interesting to see which regions of space are highly populated
by certain atoms relative to others in the trajectory or ensemble.
For example, cations or water hydrogens may tend to occupy space
around a negatively charged solute group.
Occupancies can be represented as a three-dimensional grid of values,
or volume data.
Analysis... Calculate occupancy
can be used to generate such data and display it with
Volume
Viewer.
The occupancy map can be saved to a file and later
reopened in Chimera.
The occupancy values are simply counts of how many times
an atom in the specified set falls within a grid cell,
except that the weighted-sphere option
may award increments of >1 per atom.
Both sphere options
may increment multiple grid cells per atom.
Usually, one should first define a reference set of atoms
to hold steady (the trajectory frames will be transformed to keep
these atoms in the same place and orientation, as much as possible).
This is accomplished by
selecting
the desired reference atoms and then choosing
Actions... Hold selection steady.
When the selection
is later changed, the "hold steady" atoms will not change unless
Actions... Hold selection steady
is used again.
Next, one should select
the atoms for which occupancy data will be collected. The
atoms in the selection
can be combined into a single set of occupancy data, or
segregated
by atom type.
- Starting frame (first frame loaded, by default)
- number of the first frame to include in occupancy calculations;
must be within the range originally loaded
- Step size [n]
- level of sampling within the indicated range
(every nth frame will be used)
- Ending frame (last frame loaded, by default)
- number of the last frame to possibly include (if not skipped by sampling);
must be within the range originally loaded
- Limit data collection to within cutoff distance of
any "held steady" atoms (true/false)
- whether data should be collected only
within the cutoff distance of any atom in the prior
hold steady specification. This option is ignored
if there was no hold steady specification.
- Cutoff distance
(10.0 by default) - Å distance used
to limit the volume data region
to a zone around atoms in a prior
hold steady specification
- Volume grid spacing
(default 1.0 Å)
- resolution of the resulting volume data grid
- Volume data name - name to use for
the resulting volume data set(s); the name(s) will be listed in the
Volume
Viewer interface.
For separate data sets collected for different
atom types,
the atom type symbol is enclosed in brackets and appended to the name.
- Collect data separately for each atom type
in selection (true/false)
- whether to make a separate set of volume data
for each atom type in the
selection
- Treat atoms as
- whether to consider atomic
VDW radii
in occupancy calculations
(the larger the grid spacing relative to the radii,
the smaller the differences in results among the options)
- points (default) -
increment the count for each grid cell containing an atom center
- uniform VDW spheres -
increment the count for each grid cell with any part inside the
VDW radius of an atom
- center-weighted VDW spheres -
increment the count for each grid cell with any part inside the
VDW radius of an atom,
but award cells in the outermost layer an increment of 1,
the next layer inward an increment of 2, the next layer 3, etc.
A grid cell is in the outmost layer if it overlaps the atom sphere
but any adjacent grid cell (including those diagonally adjacent) does not.
OK collects occupancy data for the
selected atoms
according to the specified starting and ending points and step values,
with trajectory frames transformed according to a prior
hold steady specification, if any.
The resulting data grid(s) are displayed with
Volume
Viewer.
The dimensions of an occupancy grid will be the smallest
needed to enclose any nonzero values (which could be smaller than the
region of data collection).
The occupancy map can be saved to a file using
File...
Save map as in the
Volume
Viewer menu.
Close closes the dialog without initiating the calculation.
Help opens this manual page in a browser window.
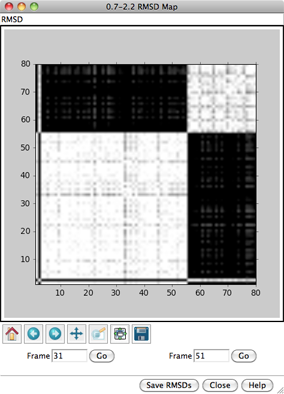
RMSD ANALYSIS
Analysis... RMSD map
can be used to generate a map of all-by-all pairwise
root-mean-square deviations (RMSDs) among specified frames.
See also:
plotting RMSD (vs. a single reference frame),
clustering a trajectory,
Ensemble Match,
match
- Starting frame (first frame loaded, by default)
- number of the first frame to include
in RMSD calculations; must be within the range originally loaded
- Step size [n]
- level of sampling within the indicated range
(every nth frame will be used)
- Ending frame (last frame loaded, by default)
- number of the last frame to possibly include (if not skipped by sampling);
must be within the range originally loaded
- Lower RMSD threshold (white) (0.5 by default)
- initial lower RMSD threshold for coloring, in Å;
white will be used for this value and lower.
If auto-recoloring is turned on,
the threshold may change after all of the values have been computed.
- Upper RMSD threshold (black) (3.0 by default)
- initial upper RMSD threshold for coloring, in Å;
black will be used for this value and higher.
RMSD values between the thresholds will be mapped to grayscale.
If auto-recoloring is turned on,
the threshold may change after all of the values have been computed.
- Restrict map to current selection, if any
(true/false) - whether to use only the
selected atoms, when a
selection exists
- Ignore solvent and non-metal ions (true/false)
- whether to ignore
solvent residues
and monatomic anions (Cl–, Br‐, etc.)
- Ignore hydrogens (true/false)
- Ignore metal ions (alkali/true/false)
- whether to ignore alkali metal ions (Li+, Na+,
K+, etc.), or all metal ions (if true),
or none (if false, thus including any metal ions)
- Auto-recolor for contrast
(true/false) - whether the RMSD map should be recolored automatically
after all values have been computed, using
thresholds that enclose the middle third of values (i.e.,
the lowest third of values will be white, the middle third in grayscale,
the highest third black)
OK and Apply initiate the calculations with and without
closing the dialog, respectively, while Close simply dismisses the
dialog. Help opens this manual page in a browser window.
For each frame-to-frame comparison, the least-squares-fit RMSD between
the indicated sets of atoms will be calculated, without applying any
transformation. The values will be shown as grayscale squares within an
RMSD map. The calculations may require
additional frames to be read (frames within the loaded range
are not actually read until viewed or otherwise used)
and may take several minutes, depending on the size of the system
and the number of frames. The Abort button at the bottom
of the RMSD map dialog allows termination of a calculation in progress.
To decrease computational time, use a sparser sampling of frames
(larger step size) and/or fewer atoms in the calculation.
Multiple RMSD maps can be open at the same time.
A given map can be recolored
(without recalculation of RMSD values) using the map's menu option
RMSD... Change thresholds to adjust the white/black
threshold settings.
When the cursor is placed over a map,
the corresponding frame numbers and RMSD value are given below the map.
Clicking on a map places the corresponding
frame numbers in the Frame fields; clicking Go
will show the corresponding frame of the trajectory in the graphics window.
Below the plot are standard
navigation icons
provided by matplotlib.
Other buttons on the RMSD map dialog:
- Save RMSDs - save the matrix of RMSD values to a text file
- Close - dismiss/delete the RMSD map
- Help - show this manual page in a browser window
Alternatively, the
Ensemble Match tool
can be used to calculate all-by-all pairwise RMSD values for an ensemble
read from a single PDB file. The file would need to be
opened in a standard way
rather than with MD Movie. Unlike MD Movie,
Ensemble Match
can perform the corresponding pairwise superpositions (i.e.
match one structure to another), but its use is impractical for
ensembles with very many members.
CLUSTERING
Analysis... Cluster can be used to cluster
the trajectory based on pairwise best-fit root-mean-square deviations (RMSDs).
A representative frame will be identified for each cluster.
For more about the method, see
Ensemble Cluster.
See also: RMSD analysis
- Starting frame (first frame loaded, by default)
- number of the first frame to include
in clustering calculations; must be within the range originally loaded
- Step size [n]
- level of sampling within the indicated range
(every nth frame will be used)
- Ending frame (last frame loaded, by default)
- number of the last frame to possibly include (if not skipped by sampling);
must be within the range originally loaded
- Cluster based on current selection, if any
(true/false) - whether to limit calculations to only the
selected atoms,
when a selection exists
- Ignore solvent and non-metal ions (true/false)
- whether to ignore
solvent residues
and monatomic anions (Cl–, Br‐, etc.)
- Ignore hydrogens (true/false)
- Ignore metal ions (alkali/true/false)
- whether to ignore alkali metal ions (Li+, Na+,
K+, etc.), or all metal ions (if true),
or none (if false, thus including any metal ions)
OK and Apply initiate the calculations with and without
closing the dialog, respectively, whereas Close simply dismisses the
dialog. Help opens this manual page in a browser window.
For each frame-to-frame comparison, the least-squares-fit RMSD between
the indicated sets of atoms will be calculated, without applying any
transformation. The calculations may require
additional frames to be read (frames within the loaded range
are not actually read until viewed or otherwise used)
and may take several minutes, depending on the size of the system
and the number of frames. The Abort button on the progress dialog
allows terminating the calculation. To decrease computational time,
use a sparser sampling of frames and/or fewer atoms in the calculation.
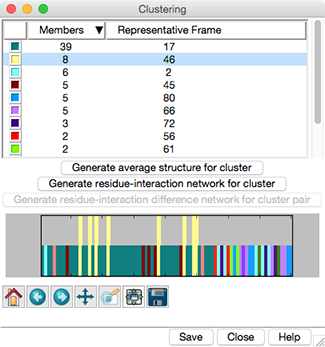
Trajectory Cluster Dialog
Clustering results are shown in a dialog. The top part of the dialog
lists the clusters, and for each, the number of Members
(how many of the input frames belong to the cluster)
and the frame number of the best representative.
Different colors are used to show membership in the different clusters
within the timeline plot in the bottom part of the dialog.
The color used for a cluster can be changed by clicking its
color well and
using the Color Editor.
Clicking the line for a cluster in the top part of the dialog
displays its representative frame in the main window
and makes the bars for all of the members of that cluster taller
on the timeline plot. The current frame is indicated with an
inverted triangle on the plot, and the trajectory can be navigated
by moving the triangle,
just as in the MD Movie controller dialog.
Although more than one cluster can be chosen with the mouse in the
top part of the dialog, only one frame can be displayed at a time.
- Generate average structure for cluster -
calculate an average structure
for a single cluster chosen in the top part of the dialog
- Generate residue-interaction network for cluster
- calculate and display (with
Cytoscape)
a residue interaction network (RIN) for a single chosen cluster
(details)
- Generate residue-interaction difference network for cluster pair
- calculate and display a RIN in which the edge values are differences
in interaction frequencies between two chosen clusters
(details)
Below the plot are standard
navigation icons
provided by matplotlib.
Save allows writing the clustering information
(membership and representatives) to a text file.
Close dismisses the cluster dialog.
Help opens this manual page in a browser window.
STRUCTURE AVERAGING
An average structure can be computed for the whole trajectory
or user-specified frame ranges with
Analysis... Average structure in the
MD Movie menu, or for a chosen cluster
by clicking the Generate average structure... button
in the cluster dialog.
A simple average of the Cartesian (x,y,z) coordinates of the biopolymeric
components of the trajectory (proteins/peptides and nucleic acids)
is calculated and the result opened as a new model.
The average structure may be distorted,
especially in conformationally variable areas.
Choosing Analysis... Average structure
opens a dialog with the following options:
- Starting frame (first frame loaded, by default)
- number of the first frame to include in averaging
- Step size [n]
- level of sampling within the indicated range
(every nth frame will be used)
- Ending frame (last frame loaded, by default)
- number of the last frame to possibly include (if not skipped by sampling);
must be within the range originally loaded
The following also apply to cluster averaging:
- Align structures based on current selection, if any
(true/false)
- align the frames to be averaged by matching the
selected atoms
- Omit hydrogens (true/false)
- whether to omit hydrogens from the average structure
- Include metal ions (true/non-alkali/false)
- which metal ions to include in the average structure:
all, all non-alkali (default, omitting Li+,
Na+, K+, etc.), or none
- Name average structure (default average)
- name for the new model
Clicking OK calculates the average structure and opens it as a new model.
RESIDUE INTERACTION NETWORKS
A residue interaction network (RIN) summarizing
part or all of a trajectory can be calculated and shown as a 2D diagram in
Cytoscape 3.
In the network diagram, nodes represent residues and edges represent
interactions between pairs of residues. Currently, this feature
requires starting Chimera from inside Cytoscape, namely:
- obtaining Cytoscape 3
and starting it
-
installing the Cytoscape app
structureViz2 (if not already installed)
- from the Cytoscape menu, choosing Apps... StructureViz...
Launch Chimera
(the path to the Chimera executable can be specified via
Apps... StructureViz... Settings)
- in the resulting instance of Chimera, starting
MD Movie and reading in the trajectory
- starting a RIN calculation from MD Movie by either of the
following:
RIN calculation options
(the first three are omitted for cluster RINs):
- Starting frame (first frame loaded, by default)
- number of the first frame to include in averaging
- Step size [n]
- level of sampling within the indicated range
(every nth frame will be used)
- Ending frame (last frame loaded, by default)
- number of the last frame to possibly include (if not skipped by sampling);
must be within the range originally loaded
- Type of residue interactions
- H-bonds (default) - identify hydrogen bonds;
explicit hydrogen atoms are not required
- contacts - identify contacts of all kinds
based on distances and VDW radii
- Weight interactions by number of
H-bonds/contacts formed
(true/false)
- whether to count multiple interactions between the same pair of residues
in a frame or to simply mark them as interacting or not
- with weighting, the resulting edge value will be the average number of
interactions per frame between a pair of residues
- without weighting, the resulting edge value will be the fraction
of frames in which the residues interact
- Ignore H-bonds/contacts between covalently bonded residues
(true/false)
- Group solvent as one node (true/false)
- whether to represent all
solvent residues
as a single node in the network
- Group ions as one node (true/false)
- whether to represent all
ions
as a single node in the network
- Weighted discard-edge threshold (default 0.5)
- discard network edges representing pairs of residues with less than
the specified average number of interactions per frame
— OR (if weighting is not used) —
- Discard-edge threshold (default 0.25)
- discard network edges representing pairs of residues that interact
in less than the specified fraction of frames;
for example, if the threshold is 0.25, edges will not be drawn
between residues that interact in <25% of the sampled frames.
In a cluster difference RIN,
an edge will only be discarded if its value is below the specified
threshold in both clusters.
Clicking Apply or OK (which also dismisses the dialog) brings up
a secondary dialog for setting H-bond or contact detection parameters.
For H-bonds (see
FindHBond for details):
- Relax H-bond constraints
- whether to apply tolerances to the precise
geometric criteria;
the defaults of 0.4 Å and 20.0° work well in most cases
- Only find H-bonds
- whether to limit H-bond detection based on the current
selection:
- with at least one end selected
- with exactly one end selected
- with both ends selected
- between selection and atom spec...
[ atom-spec ]
For contacts (see
Find Clashes/Contacts
for details):
- Atoms to Check are specified by
selecting atoms,
clicking Designate, and indicating which interactions should be found:
- themselves - interactions among the designated atoms
- all other atoms (default) - interactions between the designated
atoms and all other atoms
- other atoms in same model - intra-model interactions between
the designated atoms and all other atoms
- second set of designated atoms - interactions between
the designated atoms and a second designated set (specified by
selecting atoms and
clicking Designate selection as second set)
Changing the selection
will not automatically change any designated sets.
- Clash/Contact Parameters control what will be considered a
clash (unfavorable interaction with atoms too close together)
or contact (any direct interaction, favorable or unfavorable,
based on proximity):
- Find atoms with VDW overlap >=[ cutoff ] angstroms
- pairs of atoms with overlap
≥ cutoff will be identified.
A larger positive cutoff restricts the results to more severe
clashes, whereas a negative cutoff can also identify
favorable contacts. Zero is where the VDW surfaces exactly touch
(at least for non-H-bonding atoms, see below).
- Subtract [ allowance ]
from overlap for potentially H-bonding pairs
- an allowance > 0
reflects the observation that atoms sharing a hydrogen bond can come
closer to each other than would be expected from their VDW radii.
The allowance is only subtracted for pairs
comprised of a donor (or donor-borne hydrogen) and an acceptor.
Thus, the overlap
between two atoms is defined as the sum of their
VDW radii minus the
distance between them and minus an allowance
for potentially hydrogen-bonded pairs:
overlapij =
rVDWi + rVDWj
– dij – allowanceij
Default clash criteria are cutoff 0.6 Å
and allowance 0.4 Å.
Default contact criteria are cutoff –0.4 Å
and allowance 0.0 Å.
This means pairs of atoms with VDW surfaces up to 0.4 Å apart will
be identified.
- Ignore contacts of pairs [ N ] or fewer bonds apart
(N=4 by default)
- Include intra-residue contacts (default off)
- Include intra-molecule contacts (default on)
- whether to include intramolecular interactions,
where a molecule is defined as a covalently bonded set of atoms
Clicking OK on the secondary (H-bond or contact parameters)
dialog calculates the RIN and brings up
a dialog for specifying network edge coloring and name:
- Edge weight to edge color mapping
shows the distribution of network edge values as a histogram,
with vertical bars (sliders) that can be moved and/or recolored to
define how the edges should be colored based on their values.
Clicking on a slider shows its Value in black.
Clicking elsewhere within the histogram shows the Value
(X-coordinate) of the mouseclick in gray.
A slider can be moved by dragging it horizontally or
by editing its Value directly. Holding the Shift
key down reduces the speed (mouse sensitivity) of
dragging tenfold, allowing finer control.
A slider can be added by Ctrl-clicking on the histogram, and Ctrl-clicking
on an existing slider deletes it.
The Color applies to the slider most recently moved or clicked;
clicking the square
color well opens
the Color Editor
for choosing a color interactively.
- Edge width (1/2/3/4/5/6/7/8/9/10)
- linewidth of edges in Cytoscape;
all edges in a network will be the same width, regardless of their values
- Network name: [name]
- name of the network in Cytoscape (default MD residue interactions)
Clicking Apply or OK (which also dismisses the dialog)
opens the RIN with the specified edge coloring, edge width, and
name in Cytoscape. The Cytoscape and Chimera views are linked by
structureViz2.
MD MOVIE MENU
File
- Save PDB... open a
dialog
to save the current frame or all frames that have been viewed
as a PDB file
- Record movie... set parameters for saving
image frames and encoding them as a movie file
- Load Additional Frames...
(only available for Amber trajectories and DCD files,
see formats)
read an additional trajectory file and append its frames to the end of
the current trajectory
Actions
- Hold selection steady
- transform subsequent trajectory frames to keep
the selected atoms
in the same place and orientation, as much as possible (since the
atoms may move relative to one another). For best results,
the selection should include at least three atoms, not linearly arranged,
to define a frame of reference.
If the selection is changed, Hold selection steady must be chosen
again to start using the new selection.
- Stop holding steady
- return to the default behavior of only
transforming the coordinates according to user manipulations and commands
Per-Frame
- Define script... open a dialog for
entering a script
(written in Chimera commands or Python code)
to be executed after each trajectory frame update.
OK and Apply execute the script with and without
closing the dialog, respectively. If the movie is playing, the
script will continue to be executed for each trajectory frame until
Stop running script is chosen.
- Stop running script
- do not run the script after subsequent trajectory frame updates
Analysis
- Plot... measure and plot distances, angles, dihedrals,
and/or RMSD values over the trajectory (details)
- Calculate occupancy... collect and display (with
Volume
Viewer) occupancy data for the
selected atoms
over a specified set of frames
(details)
- Cluster... cluster the trajectory based on
all-by-all RMSD comparisons among specified frames
(details)
- RMSD map...
calculate a two-dimensional RMSD map containing
all-by-all comparisons among specified frames
(details)
- Average structure...
calculate a Cartesian average structure over specified frames
(details)
- Residue interaction network...
calculate and display (with
Cytoscape)
a residue interaction network (RIN) over specified frames
(details)
ADDING A FORMAT
MD Movie uses the Trajectory module to read the various formats
(chimera/share/Trajectory, where chimera
is the Chimera installation location). Trajectory
contains a subdirectory, formats, which in turn contains
subdirectories that each correspond to the Python module for a
supported format. By convention, the module (and directory)
name for each format is the name of the format with the first letter of
each word capitalized and all other letters lowercase. For example,
the MMTK module's name is Mmtk.
A format's module is typically structured so that the code that
interfaces with Trajectory's generic format handling is in
__init__.py,
and the code specific to reading a particular format is in
another python file,
usually named after the format itself (for example, Gromos.py).
__init__.py must support the following:
- If the format name displayed to the user should be different
from the module name (usually it should, due to capitalization), then
there must be a global variable named formatName that is
initialized to the display name of the format.
- A class named ParamGUI must be defined
to handle presenting the file-loading interface to the user.
It must have two methods:
- __init__, which receives a Tkinter.Frame
instance argument. The __init__ method should populate the frame
with widgets for gathering the input information for the format from the user.
- loadEnsemble, which takes as arguments
a starting frame number, ending frame number, and callback function.
loadEnsemble needs to compose a list of the arguments
that were provided by the user to the widgets defined in
__init__, and then call this module's
global loadEnsemble function (see below) with that list as the first
argument and the start/end frame number and callback as the remaining
three arguments.
- A global loadEnsemble
function that generates an ensemble instance
(discussed later). This function is not only called by the
ParamGUI.loadEnsemble method, but also when
a metafile is used to specify the input parameters.
This function takes four arguments:
a format-specific list of input parameters, a starting frame number,
an ending frame number, and a callback function to start the MD Movie
interface. The global loadEnsemble function
should call the interface with the generated ensemble
as an argument, and should remember the provided
format-specific values as preferred defaults for
future uses of the format.
__init__.py files are very similar from format to format.
The simplest way to generate a new __init__.py file
is to copy and modify another format's.
Gromos format provides a good example, as it
involves multiple input files and a non-file parameter.
The format-specific .py file
defines an ensemble class that gets instantiated from
__init__.py's loadEnsemble function.
The ensemble class must support the following methods:
- An __init__ method that takes the format's input parameters and
start/end frames as arguments. The __init__ method may read input
files or do whatever is necessary to support the other instance methods
(such as call into a C/C++ module to read the files, as is done for
Amber format).
- A GetDict method that takes a string argument. The string
specifies what data should be returned. The possible string values are:
- atomnames - return a list of the atom names; a residue's
atoms must be consecutive
- elements - return a list of the atom elements. These should
be instances of chimera.Element
(which can be initialized with a string such as "Fe" or a number).
Trajectory's determineElementFromMass
function may be useful if the format does not specify the atomic
number directly or it cannot be determined easily from the atom name.
- resnames - return a list of the residue names
- bonds - return a list of bonds (2-tuples of indices into
the atomnames list)
- ipres - a list of the first atom of each residue (indices
into atomnames, but unlike previous indices these are
1-based, so the first element of ipres will always be 1)
- A __getitem__ method taking a frame-number argument
(starting with 1): return a list of 3-tuples corresponding to the
xyz coordinates of the atoms in that frame
(in the same order as atomnames).
The coordinates should be in Å.
- A __len__ method that returns the total number of
frames in the trajectory (not just the number of frames between the
user-specified start/end frames).
UCSF Computer Graphics Laboratory / December 2021