This tutorial focuses on using the Model Panel and handling ensembles of structures (such as those determined by NMR). Note that the Model Panel is generally useful whether or not ensembles are being viewed.
To follow along with the tutorial, you will first need to download the PDB files 1dwz-edit4.pdb and 1dwy.pdb into your working directory. These files contain NMR-determined structures of a bovine prion protein fragment. 1dwz-edit4.pdb contains the first four members of an ensemble of 20 structures (present in the original PDB entry 1dwz), whereas 1dwy.pdb is a single representative minimized structure.
On Windows/Mac, click the chimera icon; on UNIX, start Chimera from the system prompt:
unix: chimera
A basic Chimera window should appear after a few seconds. Make the window a convenient size, then choose the menu item File... Open. In the resulting dialog, check the option to Keep dialog up after Open. Make sure that the File type is set to all (guess type) or PDB, then locate the previously downloaded files. Choose 1dwz-edit4.pdb and click Open; after that structure appears, open 1dwy.pdb in the same way. Click Close to dismiss the dialog.
Rotate, translate, and scale the structures as needed to get a better look (see mouse manipulation to review how this is done). If you like, open the Side View; choosing Tools... Viewing Controls... Side View is one of many possible ways to do this. Continue moving and scaling the structures as desired throughout the tutorial.
Thicken the lines: Actions... Atoms/Bonds... wire width... 2. The structures include all atoms, even the hydrogens. Simplify the display using Actions... Atoms/Bonds... backbone only. Now only the N, CA, and C atoms are shown.
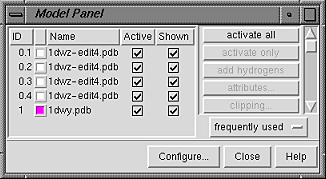
Open the Model Panel; choosing Tools... General Controls... Model Panel is one of many possible ways to do this.
| Model Panel - initial appearance |
|---|
|
Each file of coordinates opened in Chimera becomes a model with an associated ID number and model-level color. By default, the model-level colors are shown in small color wells.
Some PDB files are further subdivided into multiple structures designated with MODEL and ENDMDL records; when the input file contains more than one set of such records, submodel numbers are assigned sequentially starting with 1. In this case, the four ensemble members in 1dwz-edit4.pdb are submodels 1-4 of model 0. Each submodel (0.3, for example) can be treated as a separate model. Thus, "models" will be used to indicate submodels and/or models that are not subdivided into submodels.
Once one or more models have been chosen within the left side, any of several functions represented by buttons on the right side may be executed. At first, most buttons are grayed out since no model has been chosen in the left side of the panel. Individual models or blocks of models may be chosen (highlighted) using the left mouse button. Ctrl-click adds to an existing choice rather than replacing it. To highlight a block of models without having to hold down the mouse button, click on the first (or last) and then Shift-click on the last (or first) in the desired block.
Click on 1dwy.pdb in the left side of the Model Panel and then try various functions on the right side:
show only - hide the other modelsin the menu: Actions... Color... by element
trace chains - display the chain trace, which includes only CA atoms
show all atoms - display all atoms
select - select the entire model for further operations
Back to the Model Panel:
sequence... opens a sequence panel for the model; in that panel, select one or a string of residues in the sequence and see how the corresponding residues of the structure become selected. Next, Close the panel and perform some action upon the new selection, such asin the menu: Actions... Atoms/Bonds... sphere
Back to the Model Panel:
attributes... opens the molecule model attributes panel; within this,Back to the Model Panel:
- click the Component Atom Attributes checkbox to expand the section
- in that section, set displayed to false
- click the Component Atom Attributes checkbox again to collapse the section
- click the Component Residue Attributes checkbox to expand the section
- set ribbon display to on
- set ribbon cross section to rounded
- click Close to dismiss the panel
render by attr... opens the Render by Attribute tool, which is used to show attribute values with properties such as color and size. We will color residues by hydrophobicity. In this tool, 1dwy.pdb should already be chosen within the Models list. Change to using the attributes of residues, choose the attribute kdHydrophobicity, and click the tab marked Colors if that section is not already in front. The Kyte-Doolittle hydrophobicity values of the residues in the model are shown as a histogram; the colored vertical bars are thresholds that define how the coloring will be done. By default, the most hydrophilic residues will be colored blue and the most hydrophobic will be colored red. Move the thresholds and/or change their colors if you wish, and then click OK to perform the coloring and dismiss the tool. The most hydrophilic residues tend to be the most exposed to solvent.Back to the Model Panel:
uncheck the Shown checkbox for 1dwy.pdbNote that using the Shown checkbox is not the same as using the command display, which works on individual atoms and bonds; instead, it enables/disables the whole model's display (see display hierarchy). Checking Shown enables the display, but the display settings of individual atoms and bonds are not changed. In this example, the atoms and bonds remain undisplayed, as they were before the model was hidden; only the ribbon is displayed.
check the Shown checkbox for 1dwy.pdb
Toggling checkmarks in the Shown column is the same as using the hide and show functions in the Model Panel; toggling checkmarks in the Active column is the same as using the activate and deactivate functions (which control whether a model is activated for motion). By default, hide, show, activate, and deactivate are not included in the right side of the Model Panel because they are classified as infrequently used (this can be controlled using Configure...).
uncheck the Active checkbox for 1dwy.pdb - deactivate the model so that it cannot be moved with the mouseWith the mouse, move the four submodels of 0 so that they do not overlap with model 1. Scaling down with the mouse or the Side View may be helpful.
check the Shown checkbox for all of the models
check the Active checkbox for 1dwy.pdbFinally, Close the Model Panel.
choose all four submodels of #0 - one way is to click the first and then Shift-click the last
rainbow... opens a dialog for rainbow-coloring. This is most often used to color residues within chains, but instead click the option to change the color every model. Click OK to perform the coloring and dismiss the dialog.
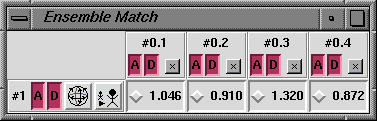
We will use the extension EnsembleMatch to compare the four NMR structures in 1dwz-edit4.pdb with the minimized structure in 1dwy.pdb. Start EnsembleMatch (Tools... MD/Ensemble Analysis... EnsembleMatch is one way) and choose the minimized structure in model 1 as the reference and the NMR structures in model 0 as the alternative. Parts to Match are the atoms to be used for superimposing the structures. Each model contains residues 124-227 of chain A; it would be possible to use all atoms, but it is often more meaningful to compare only the backbone atoms or alpha-carbons. To use the backbone atoms N, CA, and C, enter the atom specification
@n@ca@cwhich in this case is equivalent to
:124-227.a@n@ca@cThe atom specification describes the atoms to be used in each structure. Thus, if residue numbers are given, the residues in one structure must have the same numbers as the matching residues in the other structures. If atom names are given, they should specify equal numbers of atoms occurring in the same order in the different structures (if @ca is entered, the first CA in a structure is matched with the first CA in other structures, the second CA with the second in other structures, etc.). Clicking Okay brings up the EnsembleMatch interface:
 |
Finally, for fun, start EnsembleTile (Tools... MD/Ensemble Analysis... EnsembleTile is one way). Pick model 0 as the Ensemble to Tile, and click Okay. "Tilings" are sometimes used in figures to compare different molecules or different conformations of the same molecule.
Choose File... Quit from the menu to terminate the Chimera session.