Analysis of Chromosome Electron Microscope Data
Tom Goddard
January 2001
The goal is to deduce how the 30 nm chromatin fiber is packed in the
chromosome. I am particularly interested in whether the fine structure
of the electron microscope data reveals anything about the chromatin
path.
|
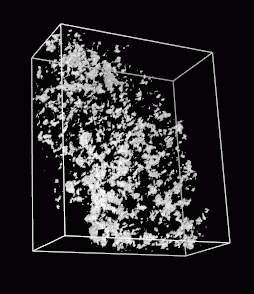
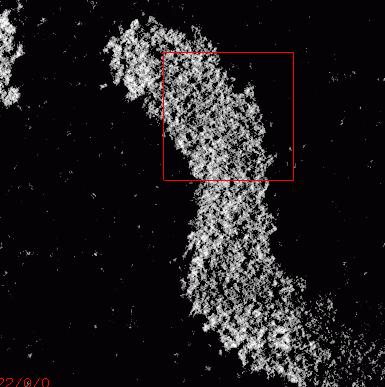
Figure 1:
|
A slice of embryo11.xyzw shown using Priism.
The 3D electron microscope data set contains an anaphase Drosophila
chromosome. The data was obtained by back projection
from a tilt series. I do not have definitive information on how
many tilt planes were used. John Sedat believes they are most likely
spaced at 1 degree from roughly -70 to +70 degrees. The resolution
is uncertain. The 3D data grid is 2.62 nm per pixel.
|
|
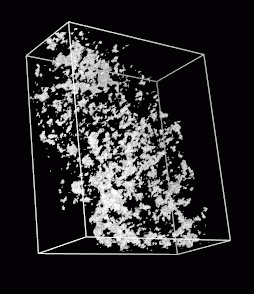
Figure 2:
|
Stereo pair showing a subregion of the embryo11 data set
using Chimera. The subregion is 128 by 128 by 64 pixels shown
in the red box in figure 1. The 3D volume can be interactively rotated
and projected using the Chimera molecular visualization program.
I made a
quicktime movie
of this subregion being rotated.
|
|
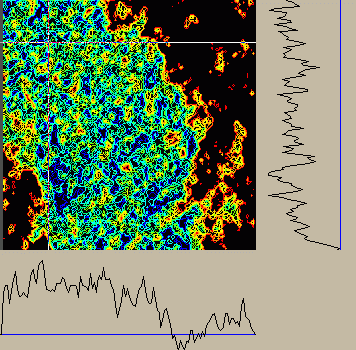
Figure 3:
|
Contour plot of 2D section of embryo11 subregion made by Sparky.
Red is the lowest contour, and blue the highest.
The graphs along the bottom and right edge show the intensity
profiles along the horizontal and vertical white lines seen in
the contour plot. The blue line in the edge graphs is positioned
at zero intensity.
I made a
quicktime movie
flipping through the 64 z-axis planes.
|
Histograms of Distances between Maxima
The local maxima in the electron microscope data indicate where the
uranyl acetate stain concentrates. The uranyl acetate is attracted
to the phosphates of the DNA backbone. The local maxima may occur
where the edges of nuclesomes discs touch since that will create a
high concentration area of DNA. The nucleosome packing in chromatin
may have some regularity. This may cause certain distances between
nearby local maxima in the EM data to be more common. So I looked
at the distances between pairs of local maxima.

|
|
|
|
|
embryo11
|
height >= 32
|
height < 32
|
simulated
|
|
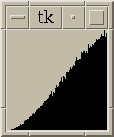
Figure 4:
|
Histograms of distances between local maxima in embryo11.xyzw subregion
and in simulated data. Histograms include all pairs <= 15 nm apart.
Histograms using only peaks with height >= 32 or height < 32 are shown.
These distiguish maxima in the chromosome from outside it.
The simulated data is produced by randomly placing
an equal number of maxima in a box. The histograms
all contain 100 bins evenly spaced between the minimum and maximum pair
distances found.
|

|
|

|
|
|
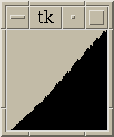
embryo11
|
height >= 32
|
height < 32
|
simulated
|
|
Figure 5:
|
Same as figure 4 with histograms for all pairs <= 30 nm apart.
|
|
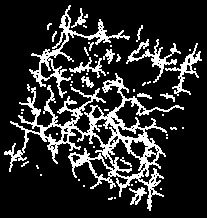
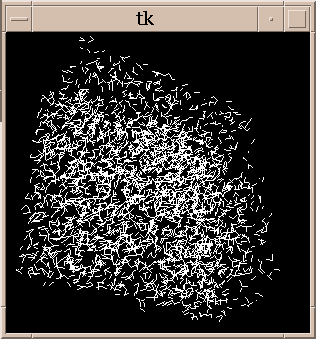
Figure 6:
|
All pairs of maxima in embryo11.xyzw subregion separated
by a distance of 9-9.5 nm. There are 3854 lines.
Hard to see anything.
|
Embryo11 Local Maxima and Pairs
Maxima min/max: -1.9 81.6
984312 pixels / 18139 maxima
 = 54 pixels / maximum
 = (3.8)^3 pixels / maximum
 = (9.9 nm)^3 per maximum
14108 maxima with height >= 32
4031 maxima with height < 32
82273 pairs within range 15.0 nm, min/max distance 2.8 nm 15.0 nm
620260 pairs within range 30.0 nm, min/max distance 2.8 nm 30.0 nm
Simulated Maxima and Pairs
18139 maxima positioned with uniform random number generator
63214 pairs within range 15.0 nm, min/max distance 0.2 nm 15.0 nm
478443 pairs within range 30.0 nm, min/max distance 0.2 nm 30.0 nm
Notes
The number of pairs of maxima within 15 or 30 nm differs between the
embryo11 and simulated data. It may be that the density of local
maxima differs in the chromosome versus non-chromosome regions.
To find the local maxima in the embryo11 grid data I test each pixel to
see if it is a maximum in the 3 by 3 by 3 pixel cube centered on it.
If so I then interpolate a quadratic along each axis and save the maxima
position as the peak of the quadratic. This interpolation can move the
maxima at most .5 pixel along each axis.
The simulated maxima can be arbitrarily close whereas the interpolated
local maxima in the grid data must be at least 1 pixel apart. This may
account for the difference between simulated and embryo11 histograms at
distances near 0.
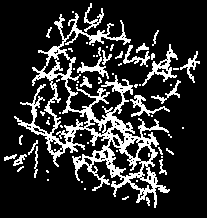
Spine of Gaussian Convolved Data
|
Figure 7:
|
Stereo pair showing spine of Gaussian convolved embryo11.xyzw subregion.
The Gaussian linewidth is 30nm (full width at half height = 25nm).
The spine is defined as points which are maxima along at least 2 of
the 3 lines through the point parallel to the x, y and z axes. This
definition is obviously not axes independent, ie not isotropic. A better
definition of spine closer to the idea that two of the principal curvatures
be negative should be used. Also color coding the lines by height or
spine sharpness would help distinguish the 3 spines crossing at each
local maxima.
|
What Next?
Drawing lines between pairs of local maxima separated by 9-9.5 nm produces
an uninformative hay stack. Need to think of another visualization technique.
Instead of looking for unusually common distances between maxima, might
get more of a signal by looking for unusually common configurations of 3, 4,
or more maxima. Maybe compare local sets of maxima and cluster them by
some measure of similarity like RMS match. The idea is that along the
chromatin strand should appear an approximately repeating geometry.
Laboratory Overview
| Research
| Outreach & Training
| Available Resources
| Visitors Center
| Search