
UCSF ChimeraX is the next-generation visualization program from the Resource for Biocomputing, Visualization, and Informatics at UC San Francisco, following Chimera. See also: ChimeraX tutorials
Many ChimeraX actions require typing commands. The help for a specific command can be shown with the help command (for example, help style). Other ways to interact with the program include:
Clicking command links in the examples below will execute them in ChimeraX if this page is shown in the ChimeraX internal browser, such as with Help... Quick Start Guide in the ChimeraX menu.
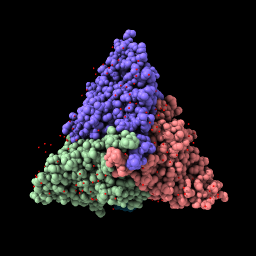
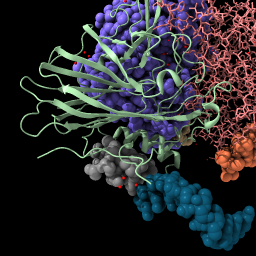
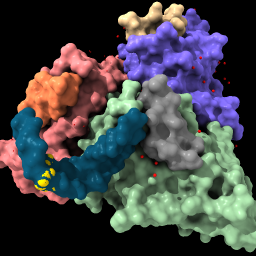
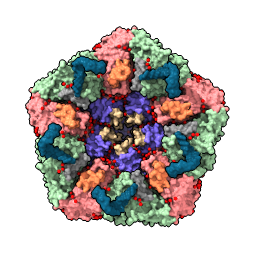
Example structure: Protein DataBank 2BBV, black beetle virus capsid
| open 2bbv color bychain | style /b stick | Mouse drag to move. color /n teal | hide /c |
| 
| 
| 
|
| File is fetched from the PDB in mmCIF format and cached locally. Lighting with shadows. | Change chain b to stick style. | Rotate by dragging, translate by dragging with middle mouse button or with option key pressed (Mac) (more...). | Hide chain c atoms. |
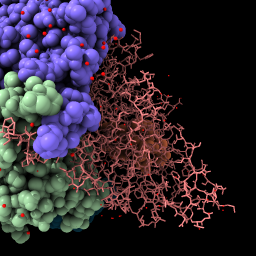
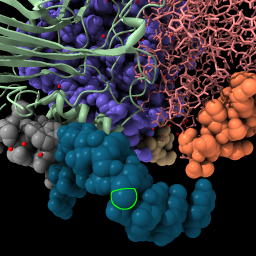
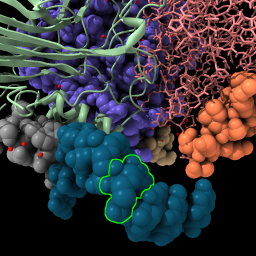
| ribbon /c | Mouse click with ctrl key pressed to select an atom,
or command select /N:4@C5' | Press up-arrow key,
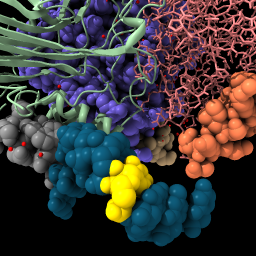
or command select up | color sel gold select clear |
| 
| 
| 
|
| Display backbone ribbon. | Selection has green outline, shift-ctrl-click to add to selection, ctrl-click background to clear selection. | Up-arrow and down-arrow keys expand and unexpand selection. | Use “sel” to refer to the selected atoms in any command. Clear the selection. |
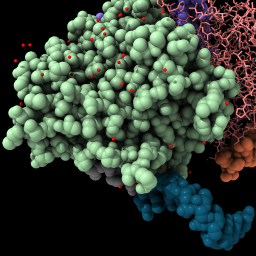
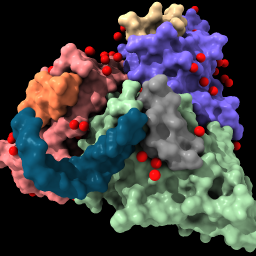
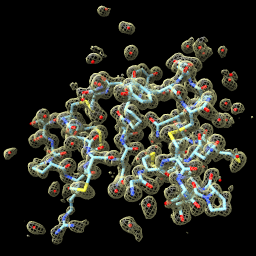
| surface #1 color /n fromatoms | style solvent sphere color solvent red | sym #1 | |||||||||||||||||||||
| 
|
| |||||||||||||||||||||
| Show the solvent-excluded surface of each chain, and color chain N to match atoms. | Enlarge waters to spheres (from balls), color them red. | List mmCIF assemblies in the Log. Do not click the links in the Log to generate an assembly since it will be done with the next command instead. (If done by mistake, however, it can be reversed with command close #2; show #1 model) | |||||||||||||||||||||
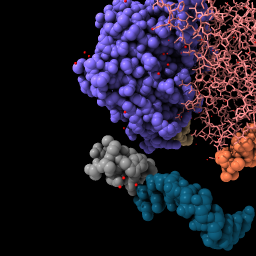
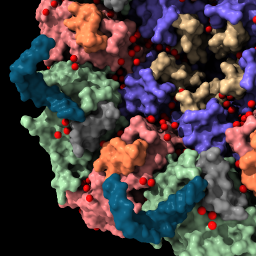
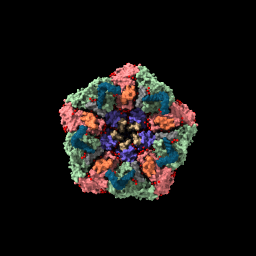
| sym #1 assembly 3 newmodel false copies false | view | set bg white set silhouettes true save ~/Desktop/2bbv.png |
|
| 
| 
| |
| Show assembly “3” according to the information in the Log from the previous command. | Bring all models into view. | Set background color to white, show thin black outlines. Save PNG image file to Desktop. | Movie saved on Desktop as movie.mp4. |
| measure buriedarea /a with /b measure sasa #1 & ~solvent | interfaces #1 & protein | close set bg black set silhouettes false |
Buried area between /a and /b = 1900.4 area /a = 15385, area /b = 14989, area both = 26573 Solvent accessible area for #1 & ~solvent = 34093 | 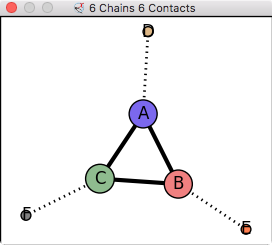
6 buried areas: C A 1675, C B 1671, A B 1663, C F 739, A D 714, B E 699 | |
| Compute solvent accessible buried surface area between chains A and B. Also compute total solvent accessible area excluding waters. | Display contact graph between all chains. | Close all 3D data. Go back to black background, no outlines. |
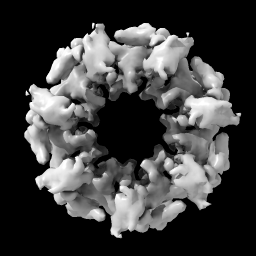
Example data:
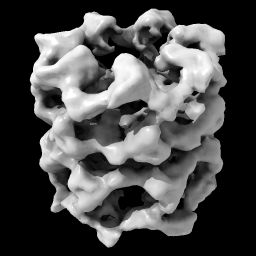
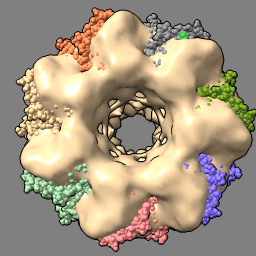
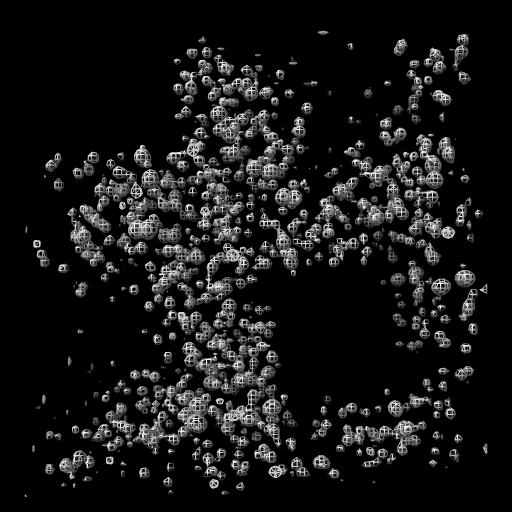
| open 1080 from emdb light full | volume #1 level 0.9 |
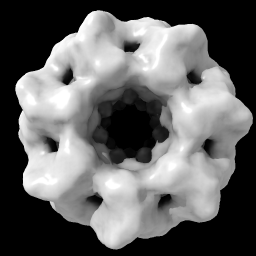
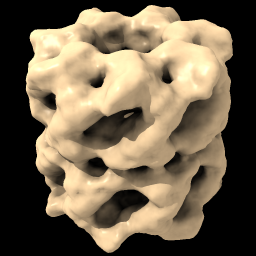
| vol #1 enclose 1e6 step 1 color tan |
| 
| 
| 
|
| Open EM Databank map 1080. Lighting with shadows. | Hover mouse over map reports contour level 1.675 in status line. Then change level. | With Mac one-button mouse drag while pressing command key. | Set level to enclose 1,000,000 cubic Å, show full resolution and set color. |
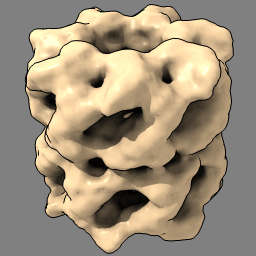
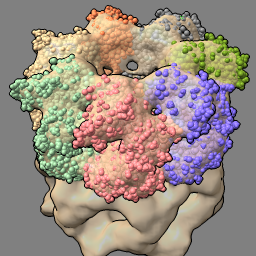
| set bg gray set silhouettes true | open 1grl light default |
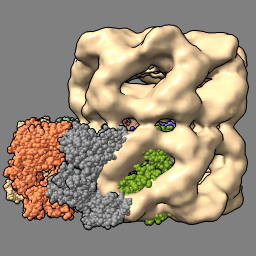
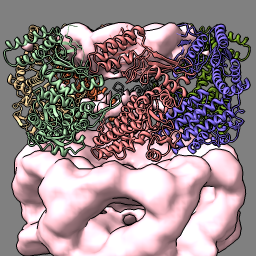
| fit #2 in #1 volume #1 transparency 0.5 |
| 
| 
| 
|
| Gray background and thin black edges. | Open atomic model to fit in map. Simpler lighting, without shadows. |
| Locally optimize fit of atomic model in map. Make map 50% transparent. |
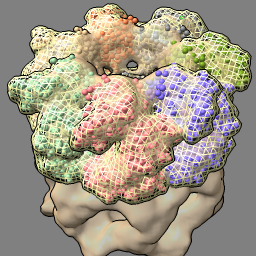
| molmap #2 10 vol #3 style mesh | vol subtract #1 #3 minrms t vol #4 color pink transparency 0 hide atoms; show ribbon |
| 
|
| Create simulated map for atomic model at 10 Å resolution and show as mesh. | Subtract simulated map from experimental map. |
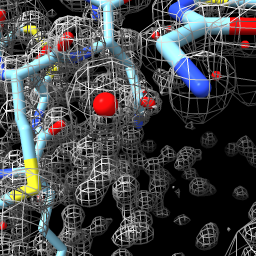
| close set bg black set silhouettes false open 1a0m from eds | open 1a0m hide ribbon show atoms vol #1 level 1.0 style mesh | vol zone #1 near #2 range 2 vol #1 level 0.5 transp 0.6 |
| 
| 
|
| Open x-ray map for PDB 1a0m from Uppsala Electron Density Server. | Show atomic model and adjust contour level of x-ray map. | Show map zone within 2 Å of atoms. |
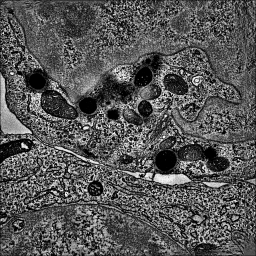
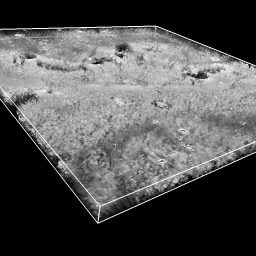
| close open emdb:1273 | volume #1 region all showOutline true |
| 
|
| Open tomogram of a T-cell (200 Mbytes), single-plane grayscale displayed because of large map size. | Show all planes of tomogram, grayscale rendering. |