Tom Goddard
June 29, 2010
Segger is an extension to UCSF Chimera used to segment electron microscopy density maps.
Segger is included in Chimera daily builds as of June 15, 2010.
For large density maps (> 500 Mbytes) we suggest using a 64-bit version of Chimera and a machine with more than 4 Gbytes of memory to avoid running out of memory.
Segger provides 4 ways of segmenting objects in density maps.
I've only made extensive use of the first 3 methods. All of the methods involve building up objects by grouping small regions. The small regions are calculated using watershed segmentation -- each region corresponds to a single local maximum of the density map and consists of all grid points which are connected to that local maximum by a steepest ascent walk.
Smoothing a density map is often needed before segmenting to avoid slow performance caused by excessive numbers of watershed regions. Maps of size 256 cubed with grid spacing about 1/3 of map resolution are managable on 2010 desktop computers, while larger maps may need smoothing and binning to allow interactive calculation speeds.
Segger can handle 100,000 watershed regions but will be unusably slow with 1,000,000 watershed regions (because each region is a Python object and Python is an interpreted language that is much slower than compiled languages like C++). A modest size map of 256 by 256 by 256 grid points (16 million) can easily have a million local maxima if high noise is present at each grid point.
Gaussian smoothing using the Chimera Volume Filter dialog can reduce the number of local maxima. After smoothing it will also improve performance to reduce the size of the map by binning. This can also be done using the Chimera volume filter dialog or the equivalent vop command.
As a rule of thumb the data resolution will be reduced to about 6 times the Gaussian standard deviation used in filtering. It is desirable for visualization and analysis to use a density map oversampled by 3 times in each dimension. So binning should aim to reduce map size to about twice the Gaussian standard deviation used.
This method of segmenting is well-suited to segmenting single-particle electron microscopy maps and is the original Segger method described in the following journal article
Quantitative analysis of cryo-EM density map segmentation by watershed and scale-space filtering, and fitting of structures by alignment to regions.
Pintilie GD, Zhang J, Goddard TD, Chiu W, Gossard DC.
J Struct Biol. 2010 Jun;170(3):427-38.
and there are tutorials for older versions of the Segger dialog available at the Segger web site.
|
|
|
|
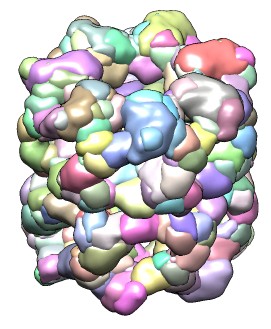
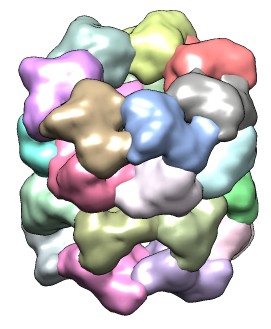
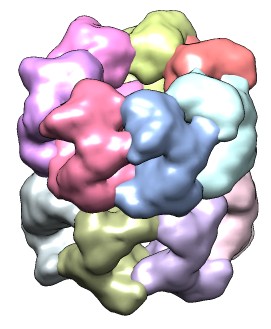
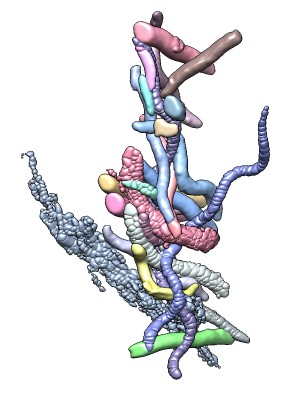
| 428 watershed regions of GroEL map (EMD 1080, contour level 1.0). | 28 regions after default 3 rounds of smoothing and grouping. | 14 regions, one for each molecule, after smoothing and grouping to standard deviation 6 times grid spacing. |
The idea is to apply additional Gaussian smoothing to the density map producing fewer local maxima, and join the original watershed regions that are connected to the same smoothed map local maxima by a steepest ascent walk. Several rounds of smoothing and joining can be done.
This method is used by selecting a density map from the menu in the Segment Map dialog and pressing the Segment button on that dialog. By default 3 rounds of smoothing using a Gaussian standard deviation equal to the density map grid-spacing (minimum along 3-axes if non-isotropic), twice that value, and then three times that value. Those parameters are set in the Segment Map dialog Options panel. The resulting segmentation of molecules in a molecular assembly seen by single-particle EM is rarely perfect and can then be hand-edited.
If the Group button at the bottom of the Segment Map dialog is pressed and no regions are selected then one additional round of smoothing and grouping is done. If one round produces no change in the regions, then additional rounds are automatically done until some additional grouping occurs.
Pressing the Ungroup button with nothing selected undoes the last round of smoothing and grouping.
This method of segmenting is often used after the smoothing and grouping method produces a regions that are closest to a correct segmentation. If a region is too large it can be selected with the mouse by clicking it with the Ctrl key held down and then split by pressing the Ungroup button at the bottom of the Segment Map dialog.
Multiple regions can be joined into a single region by selecting them. Use ctrl-click to select the first and shift-ctrl-click to add additional regions to the selection. Then press the Group button at the bottom of the Segment Map dialog.
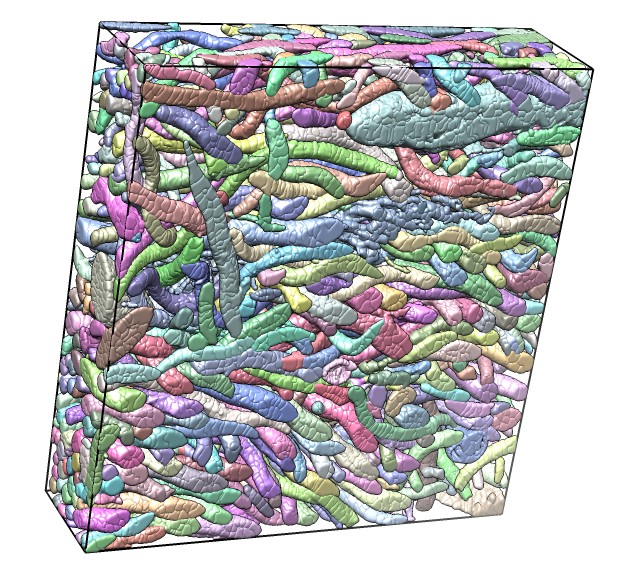
The third method of grouping regions uses mouse clicks and drags to join contacting regions. This method was developed for segmenting many minimally touching objects -- hundreds of bacteria in termite hindgut. This mouse mode is enabled using the Options panel of the Segment Map dialog by turning on
Group with mouse [button 3]
| 
| 
|
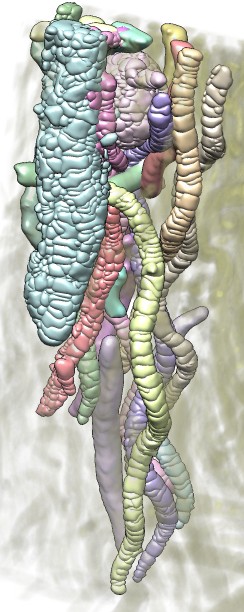
| Bacteria in termite hind-gut, focused-ion-beam scanning EM (FIBSEM) data from Bernhard Knierim, Monica Lin, Manfred Auer, LBNL. | One bacterium and its contacting neighbors. | Another bacterium and its neighbors. |
After opening a density map and selecting it in the "Segment Map" menu at the top of the Segment Map dialog, use the right mouse button (button 3) to click on the map. The first click will take some time to process since it calculates the watershed regions and the surfaces using the currently displayed map contour level. When the calculation finishes it will display all regions connected to the clicked density in a different color. Those have now been grouped as a single region and are shown in one color.
Hide the density map using the Volume Viewer dialog "eye" icon (to the right of the step size menu) or by using the Model Panel to unshow it.
Now click one of the watershed regions and drag down to reduce the size of the group, or drag up to increase the size of the group. The coloring and regions shown will interactively update. The colored regions are the current group and the gray regions nearby are the contacting regions that are not part of the group. When the mouse button is released it will define the new group.
Each group will be given a new color. When extending a group by dragging the mouse up, the group will not extend into an already existing group.
When the mouse is being dragged the adjacent watershed regions outside the current grouping are shown in gray (ungrouped) or another color (already grouped). Releasing the mouse will show all the watershed regions that are part of contacting groups.
Clicking on the background with the right button will show all regions in the segmentation.
Here is how dragging the mouse controls which regions are grouped. The mouse drag sets a density map level and all regions connected to the initially clicked watershed region above that density level are grouped.
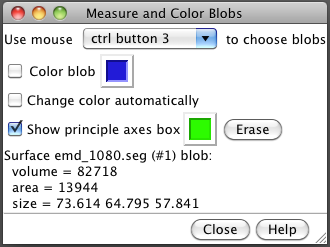
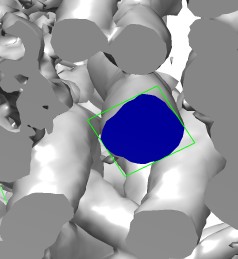
The volume, surface area and dimensions of segmented objects can be measured with the Measure and Color Blobs dialog, menu entry
Tools / Volume Data / Measure and Color Blobs
| 
| 
|
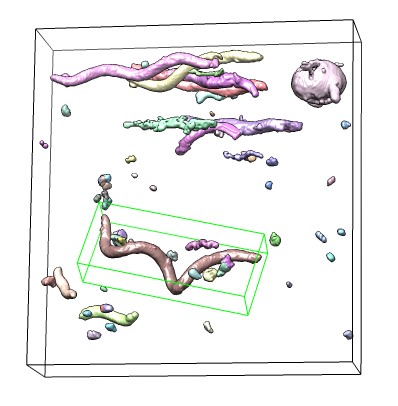
Turn off the "Color blob" option and enable the "Show principal axes box" option. Using ctrl-button-3 (right mouse button) to click on a surface will show its measurements. If a group is shown as multiple watershed regions you can show it as a single surface for measurement by selecting a region and using the Segment Map menu entry
Regions / Show Group Surfaces
Measure and Color Blobs can be used with clipping to measure the faces of clipped objects, for example, cross-section diameters. Either per-model clipping which creates clip planes that are fixed relative to models, or near-far clipping that clips parallel to the screen can be used.
Use the Segment Map dialog menu entry
File / Save Segmentation As...
to save a segmentation file. This saves in a file format based on HDF5 that is only used by Chimera. You can open the segmentation later using the Chimera main window File / Open... dialog.
Segmentations are *not* saved in Chimera sessions by the File / Save Session... menu entry. Make sure to save your segmentation before quiting Chimera.
You can group regions of one segmentation based on their overlap with regions in another segmentation. This for instance allows "copying" a segmentation done on one filtering of a density map onto another filtering of the same density map (maybe higher resolution, different binning, ...). The Chimera command to achieve this looks like:
segment copygroups #0 #1
Here #0 is the source segmentation model and #1 the destination segmentation. The model numbers are shown in model panel (menu Favorites / Model Panel) and the command-line for typing this command is shown with menu Favorites / Command-Line. You need to create the initial segmentation of the new density map including the watershed regions before running the command. You can do that by clicking on the map with the grouping mouse mode or pressing the Segment button with smoothing iterations set to zero in the Options panel.
Segger runs on Mac, Windows and Linux. The interactive performance becomes very poor on Mac OS 10.6 machines (probably earlier Mac OS versions too) when more than 5000 region surfaces are shown. This appears to be a system graphics memory management problem and effects both ATI and Nvidia graphics cards. Tests on a Linux system with ATI Radeon HD 4850 graphics easily handled 50,000 region surfaces while the same graphics on Mac becomes quite slow with just 5,000 surfaces. It does not seem to depend on the size of each surface.
The poor Mac performance can be improved somewhat allowing reasonable performance with 5000-10000 surfaces by disabling use of OpenGL vertex buffer objects (VBO) in Chimera. This is done using the Debug Graphics Driver dialog. This requires a tedious process of setting a Chimera preference to show the debugging dialog at start-up, save that preference, restart Chimera, change the setting, and then turn off showing the debug dialog and save. Disabling VBO makes Chimera use an older technology OpenGL display lists which probably get converted to VBO internally but about twice as many surfaces can be handled with this method. We don't expect Apple to fix this problem any time soon.
Slow rendering can also be cause by displaying surfaces with millions of triangles so the graphics card simply isn't fast enough. To improve performance in this use the Segment Map dialog Option
Surface granularity [1]
Surfaces are drawn as many small triangles. The default setting of "1" gives surface triangles about equal to the density map grid spacing. A value of "2" will make the triangles twice as large (4 times the area) and reduce their number by about a factor of 4, often improving rendering speed by a factor of 4.
Chimera draws a green outline around selected surfaces. This increases the time to draw a single frame as much as a factor of 5. If rotating the models is slow, avoid having any objects selected when the selection is not needed.
The development version of the Segger source code is at SourceForge and can be downloaded without a password using the following command in a terminal:
svn co https://segger.svn.sourceforge.net/svnroot/segger Segger
This creates the directory Segger which you move into your Chimera distribution to
chimera/share/Segger
or with Mac versions of Chimera move it to
Chimera.app/Contents/Resources/share/Segger
On the Mac to see inside the Chimera.app folder ctrl-click on the icon and choose "Show package contents".
After moving the Segger directory to this location and restarting Chimera you should have new menu entries:
	Tools / Volume Data / Segment Map
	Tools / Volume Data / Fit Segments
No compilation is needed since all Segger code is in the Python language.
Development Segger code will usually require a very recent Chimera daily build to work correctly. We frequently add new code to Chimera for use by the development version of Segger, so normally an up-to-date Chimera daily build is needed.