MAGNETIC (Modular Analysis of Genomic NETworks In Cancer)
Connecting tumor genomics with therapeutics through multi-dimensional network modules. Webber JT, Ranall MV, Kaushik S, Bandyopadhyay S. bioRxiv. 2016; doi: http://dx.doi.org/10.1101/083410.
[back to ECM SPOKE pages index]
Fig 2: The MAGNETIC workflow

- normalized DNA copy-number, methylation, somatic mutations, mRNA expression and protein abundance data from a collection of tumor samples (TCGA data for 941 breast cancer patients)
- calculate the correlation between all pairs of gene features both within and between profiling platforms → multilayer gene similarity network (5 data types, 15 edge types)
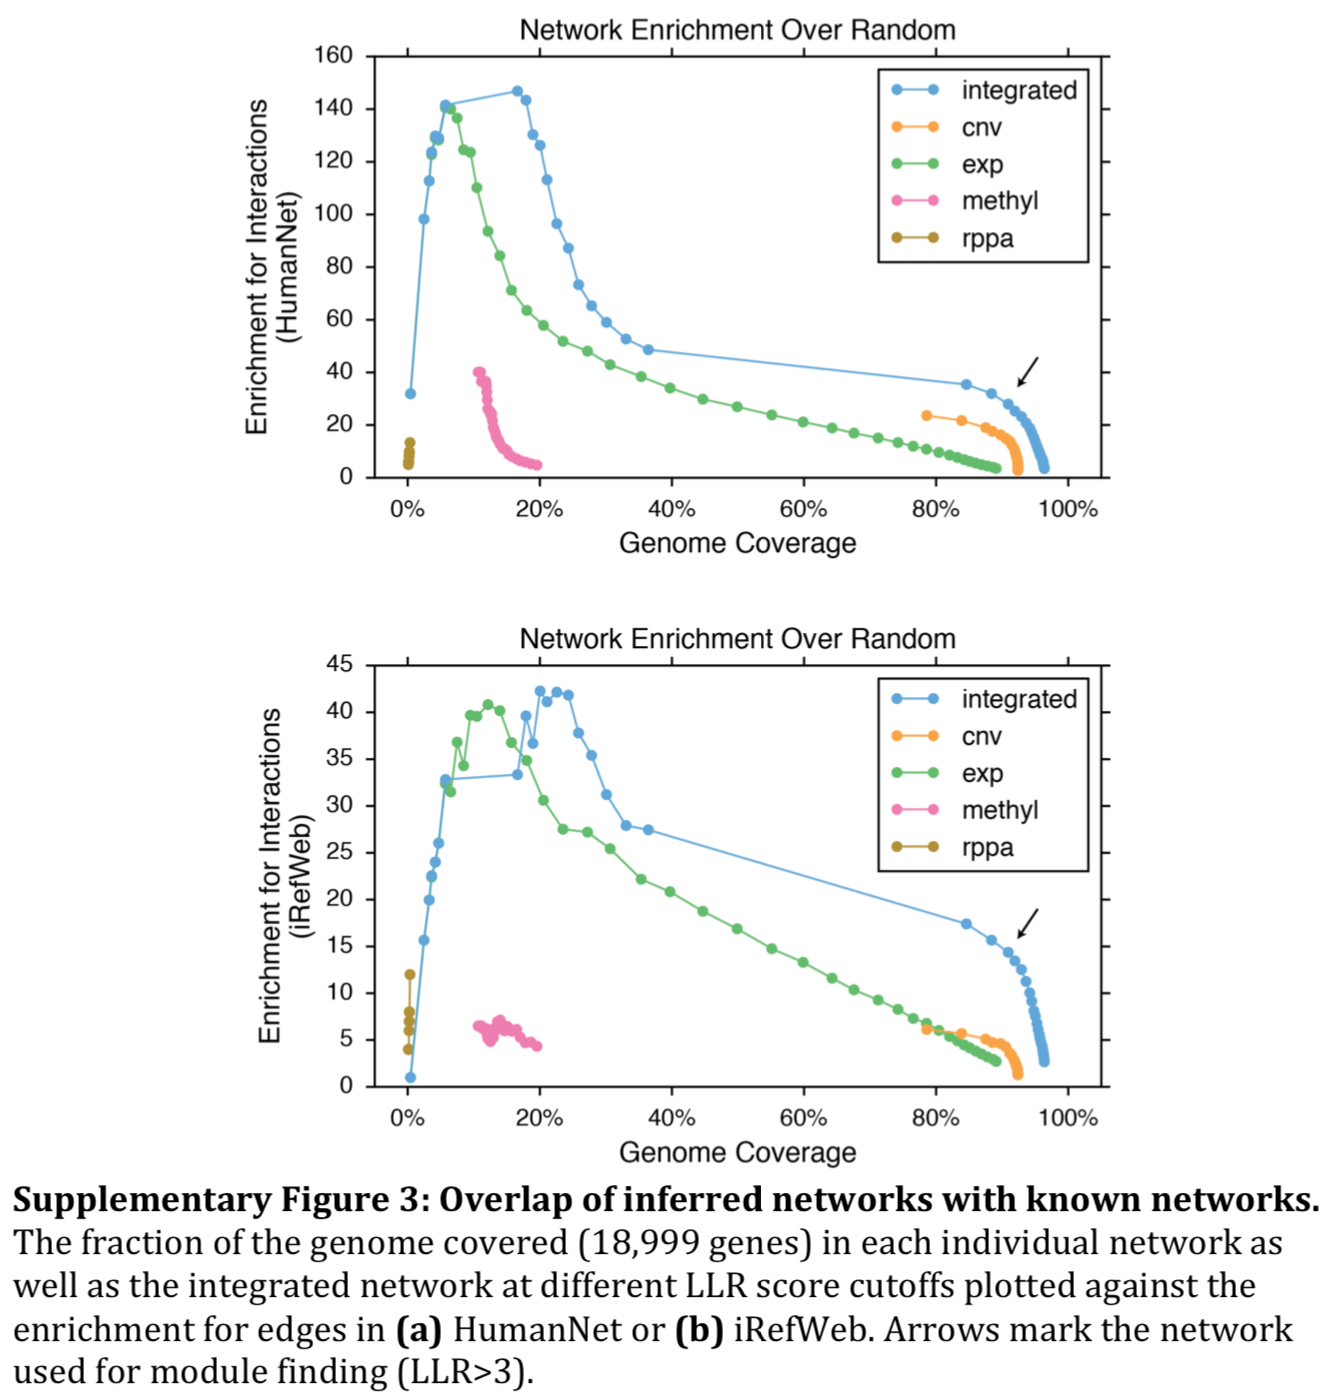
- rescore each edge in this correlation network by comparison to a benchmark of 60,194 functional PPIs from HumanNet (new score = LLR [log-likelihood ratio] of representing a known PPI)
- merge into an integrated network in which nodes represent genes and multiple edges between nodes represent coincidence of different types of linkages
- cluster at LLR >3 using random walk to identify modules
Fig 1: Examples of Correlation and Rescoring

- (a,d): STRING network, correlation (P-value), significant
- (b,e): scatter plot of normalized data
- (c,f): enrichment based on the fraction of gene pairs at a given correlation value found to interact in HumanNet vs. random background
Module Characteristics
- module score = edge-weighted sum of node values, normalized across samples to control for the different numbers of genes in modules
- merge modules with highly correlated scores → 219 modules
- median size 18 genes
- 84.5% reflect data from multiple platforms
- 44% contain known PPIs
- 16% significantly enriched for a GO, KEGG, or Reactome pathway or function
Consensus Clustering
- construct matrix of module scores across patients
- Ward hierarchical clustering of 80% subsample, repeat 5000x → new matrix of patient-patient co-clustering values
- cluster co-clustering matrix with the Ward method, k=3-10, use k with highest average silhouette score (I have no idea what this means)
Fig 3: Consensus clustering gives three patient groups (breast cancer subtypes)

- Cluster 1 - largely ER/PR positive
- Cluster 2 - largely triple-negative, TP53 mutations
- Cluster 3 - mixed ER, PR and HER2 positive
Controls
- integrated network outperformed any single correlation network type (Supp Fig 3)
- similar results using iRefWeb instead of HumanNet
- independent validation: consensus clustering of modules based on CNV and expression data for 1,966 patients in the METABRIC study gave basically the same three subtypes (Fig 3f, previous slide) and both were largely in agreement with previous approaches
Specific Modules Discussed
- #27: genes with promoters marked by histone H3 K27 trimethylation
- #3: genes related to lymphocyte infiltration
- #12: stromal gene signature
- #16: vascularization
Are the Modules from the TCGA Cohort Also in Cell Lines?
- 82 breast cancer cell lines
- for each module, calculate a preservation score: average of edge Z-scores, each from comparison to the overall distribution of correlations for that edge type
- preservation threshold excluded 59/219 modules, some evidently associated with the tumor microenvironment
- "Modules associated largely with gene expression or methylation were much less likely to be preserved"
- "copy-number variation and mutation are more likely to yield clinically translatable biomarkers because they are the most robust to issues such as tumor purity"

Module-Drug Relationships
- the 82 breast cancer cell lines were profiled with 90 drugs
- module scores correlated with drug response (IC50 values)
- 271 module-drug relationships covering 74 drugs and 99 modules (FDR, false discovery rate ≤5%)
- 97 connections where module + cell-line subtype were more predictive than subtype alone (only drugs without subtype association at FDR≤5% shown below)

Are Modules More Predictive of Drug Response than Individual Genes?
- "modules perform comparably to genes as features used to build predictive models of drug responses using common methods of machine learning"
- "Applied to all drugs, biomarkers based on genes had a significantly reduced cross-correlation in the TCGA when compared to cell lines, whereas module-based approaches maintained a consistently high cross-correlation"

Summary
- clinically relevant cancer-subtype biomarkers can be identified as gene modules in multi-omics networks with edges scored by the likelihood of representing a known PPI
- joint analysis of patient (tumor biopsy) and cell line data suggests that modules preserved in both contexts are more robust as biomarkers