Chimera Coulombic Coloring vs. Published ESP Figures (May 2009)
Published figures of molecular surfaces colored by electrostatic
potential (ESP) are usually based on Poisson-Boltzmann calculations.
Coulomb's law calculations are simpler and more approximate, and do
not account for the spatial distribution of high and low dielectrics,
i.e., the shape of the protein.
Thus, quantitative agreement is not expected; the
equations are simply different.
However, such published figures are generally intended for
qualitative interpretation (e.g., the positive patch binds DNA).
I wanted to see whether the
Coulombic Surface Coloring
tool in Chimera could just as well be used for such illustrations.
For this informal comparison, I chose a few published images for which
the corresponding structures were available. These examples were not
chosen scientifically, but they were not cherry-picked.
They were all the cases I tried.
Conclusion: At least for this small sample, Chimera's
Coulombic Surface Coloring
tool produces results remarkably similar to the published images
(more than I had expected). The default Coulombic parameters
(ε = 4r, thresholds ± 10 kcal/mol·e, etc.)
tend to give the best results.
If the goal is to make the coloring look the same as in the published image,
it can generally be achieved by changing the thresholds by a factor of
≤3 from the defaults. In my opinion, however,
some of the published figures use thresholds that are too low,
losing the dynamic range of the coloring.
Below are figures from Chimera only!
Click the links to see the published figures.
(requires online access to the publications, such as an
institutional subscription)
Structural basis for high-affinity peptide inhibition
of p53 interactions with MDM2 and MDMX.
Proc Natl Acad Sci U S A. 2009 Mar 24;106(12):4665-70.
See Fig 4.
Figures uncredited but look like Pymol. Legend only says
negative is red, positive blue, neutral white.
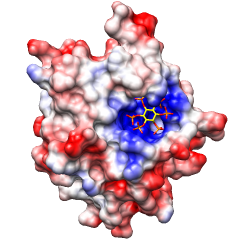
Main point: in the complex on the right, the peptide Cterm (yellow, right end)
occupies a hydrophobic cleft that is not present in the complex on the left.
|
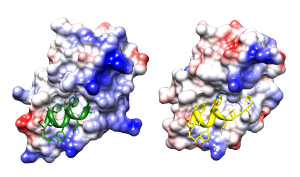
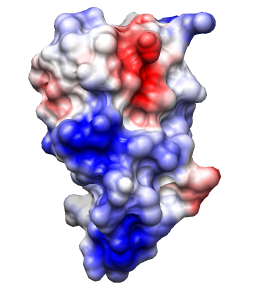
Coulombic Surface Coloring defaults:
ε = 4r, thresholds ± 10 kcal/mol·e.
Structures 3eqs and 3eqy, altlocs B deleted, glossy lighting.
[session]
|
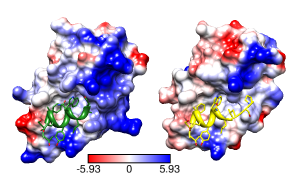
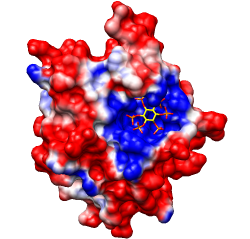
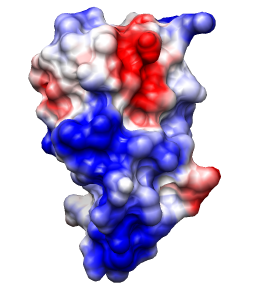
Same except thresholds ± 5.93 kcal/mol·e
(=10 kT/e).
Note: identical results can be obtained by decreasing the Coulombic dielectric
instead of the thresholds, another reason to not become overly focused on
quantities.
|
Crystal structure of the breakage-reunion domain of DNA gyrase.
Nature. 1997 Aug 28;388(6645):903-6.
See Fig 3A (top view). Description mentions GRASP,
negative red, positive blue, but not threshold values.
(However, the same molecule is also shown in the
previous example with
thresholds ± 5kT/e.)
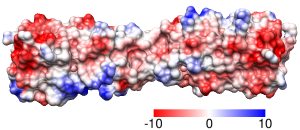
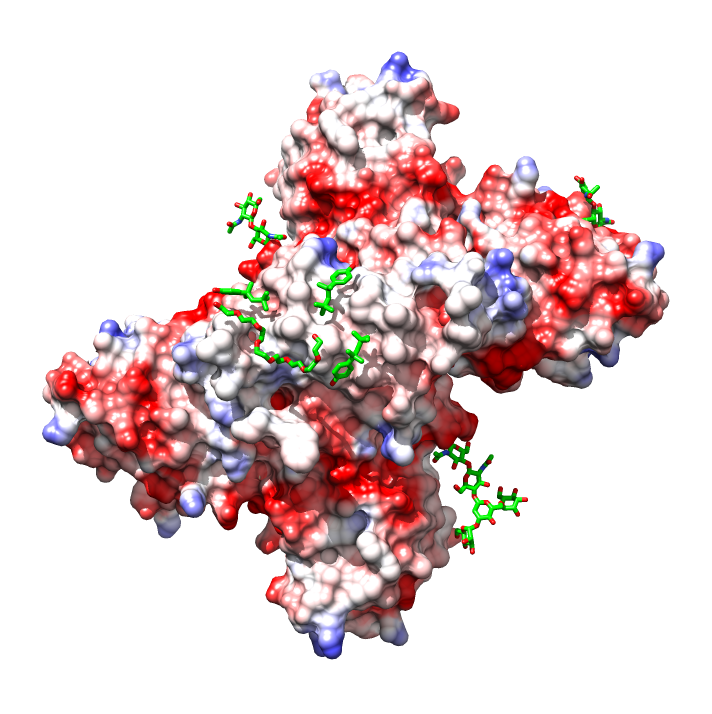
Main point: large positive patches line the DNA-binding notch.
|
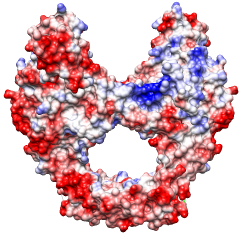
Coulombic Surface Coloring defaults.
Structure 1ab4, dimer generated with sym and merged into one model
with combine. [session]
|
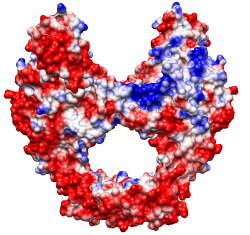
Same except thresholds ± 5.93 kcal/mol·e (=10 kT/e)
|
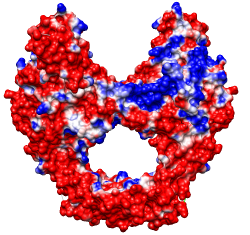
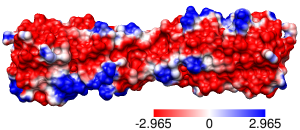
Same except thresholds ± 2.965 kcal/mol·e (=5 kT/e)
|
Another (March 2014)