Cavity Detection
|
| large image |
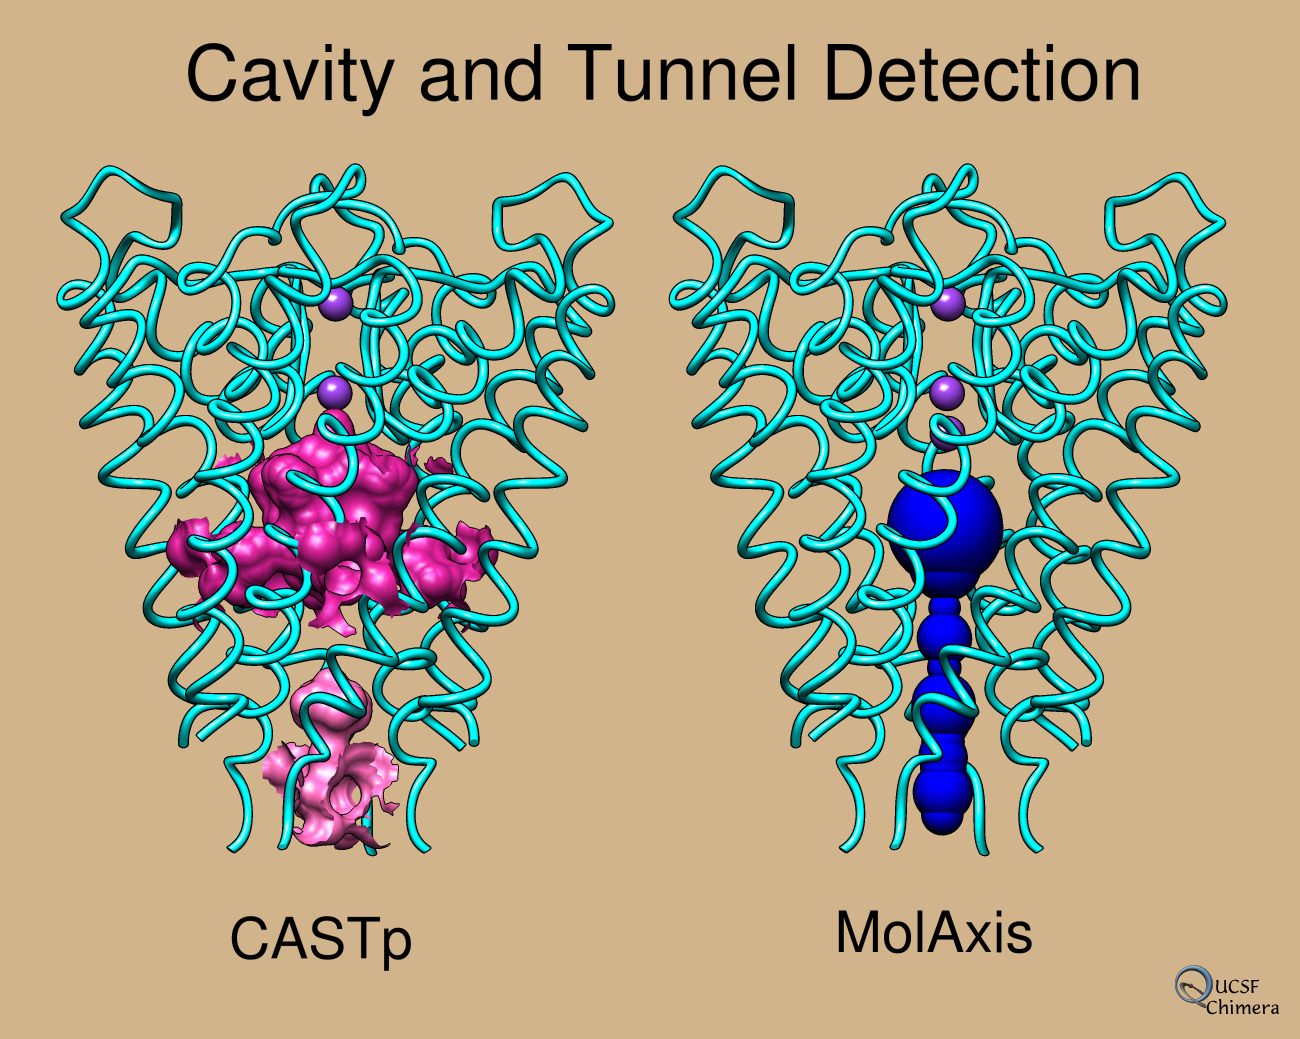
Side-by-side views of a potassium channel structure (Protein Data Bank entry 1bl8) showing different approaches to cavity detection. On the left are molecular surface patches in darker and lighter pink corresponding to the structure's two largest pockets by MS volume in the Computed Atlas of Surface Topography of proteins (CASTp) database. CASTp pocket information can be fetched directly from within Chimera. On the right is a tunnel in blue identified by the MolAxis server. The downloaded result file 1bl8.graph_pathway_0_all was converted to a Chimera BILD file by simply inserting ".sphere" at the beginning of each line and adding the line ".color blue" at the top (format description).
The orthographic projection is shown (perspective has been turned off), the background is tan, and the image includes silhouette edges and 2D labels. The subdivision quality is 5.0 and the molecular surface vertex density is 6.0.
The entry Sliced Potassium Channel provides yet another view of the same structure. See also: MOLEonline