
|
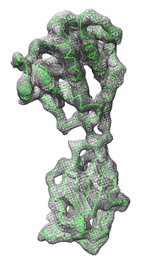
Fit Models in Maps optimizes the fit of molecule models to density maps (a type of volume data). The molecule models are rigidly repositioned to maximize the sum of the density values at the selected atoms. Local optima are found, not generally the global optimum.
There are several ways to start Fit Models in Maps, a tool in the Volume Data category.
A molecule model should first be placed in a trial position, approximately the position thought to be correct or one that might be correct, and the atoms to be used for fitting selected. If the selected atoms belong to more than one model, the models will be fitted using the same rigid motion (without changing their orientations relative to one another). The density map should be the current set of data in Volume Viewer.
Clicking Fit calculates a position that maximizes (locally) the sum of the densities at the selected atoms. Both rotation and translational shift displacements may occur unless disallowed by unchecking the corresponding checkbutton. The calculation will stop and the structure will be repositioned after the earliest of the following: convergence, 100 steepest-ascent steps, or when Halt is clicked. The resulting average density value at the selected atoms, the number of steps taken, and the total displacement (translational shift, angle of rotation) are reported in the Fit Models interface and written to the Reply Log. The transformation matrix of the fitted model is also reported in the Reply Log.
Clicking Fit again may further improve the fit, especially if convergence was not reached. Clicking Average map value reports the average of the density values at the selected atoms without performing any fitting.
For each atom within the bounds of the volume data, the density value is found by trilinear interpolation from the eight corners of the enclosing volume grid cell. Non-orthogonal data are handled correctly. Atoms outside the bounds of the volume data are not used for computing the average.
Undo Move (Tools... Movement... Undo Move) can be used to return the structure to its position prior to fitting.
Close closes the Fit Models interface. Help opens this manual page in a browser window.
Transformation matrices. After a fit is performed, the transformation that positions the model in the map is reported in the the Reply Log. The first three columns of the matrix describe a rotation and the fourth describes a translation (performed after the rotation).
Comparing fits. Because local optima rather than a global optimum are found, it is often beneficial to explore and compare different fits. This can be done by opening multiple copies of a molecule model and fitting the different copies from different starting positions. Fits can be compared by their average density values. In addition, the command rmsd can be used to calculate the root-mean-square displacement between two fits (for example, "rmsd #1 #2" to compare copies that are models 1 and 2). The Model Panel can be used to hide and show individual copies.
Clipping and hiding are ignored. The calculation uses the full set of density data, even if part of it is hidden by clipping planes, zoning (with Surface Zone or zoning in Volume Viewer), or subregion selection in Volume Viewer.
Optimization algorithm. Optimization is by steepest ascent to maximize the sum of the density values at the selected atoms. If rotation and translation are both allowed, every even step is a translation and every odd step is a rotation. The center of rotation is the centroid (average position) of the selected atoms. The initial step size is chosen so that the largest atom displacement is 0.5 grid units, where a grid unit is the spacing between grid points. If after four steps the maximum cumulative displacement is less than half the displacement achievable if all steps were in the same direction (e.g., half of 2.0 grid units = 1 grid unit), the step size is halved. Successive rounds of four steps with fixed step size and halving the step size based on the maximum displacement criterion are repeated until step size falls below 0.01 grid unit (convergence) or 100 steps have been taken. Density gradients at atom positions are calculated using trilinear interpolation of the gradients at data grid points. Gradients at grid points are calculated by the center difference method. Atoms outside the volume data or within one voxel of the edge of the data at a given step do not contribute to the optimal direction at that step.
Speed. Fitting 60,000 atoms using 76 steps takes about 15 seconds on a 2 GHz PC system (circa 2005). The time taken is proportional to the number of selected atoms. Selecting just the CA backbone atoms of a protein will allow substantially faster calculation than using all atoms. The optimization calculation is written partly in C++ for speed and partly in Python.