There are many programs for showing tunnel/cavity surfaces and sometimes other data such as profile plots. A non-exhaustive list:
- Caver
and Caver
Web, described in
Petřek et al.,
BMC Bioinformatics 7:316 (2006) and
Stourac et al.,
Nucleic Acids Res 47:W414 (2019), respectively.
- Example in recent publication: Ext Data Fig 9 (Nature 2022 Oct 13) made with the Pymol Caver plugin
- server first finds pockets using Voronoi tessellation, reports their volumes and estimated druggability...
- ...then allows choosing a pocket as starting point for tunnel calculation
- download zip includes scripts for Pymol and VMD
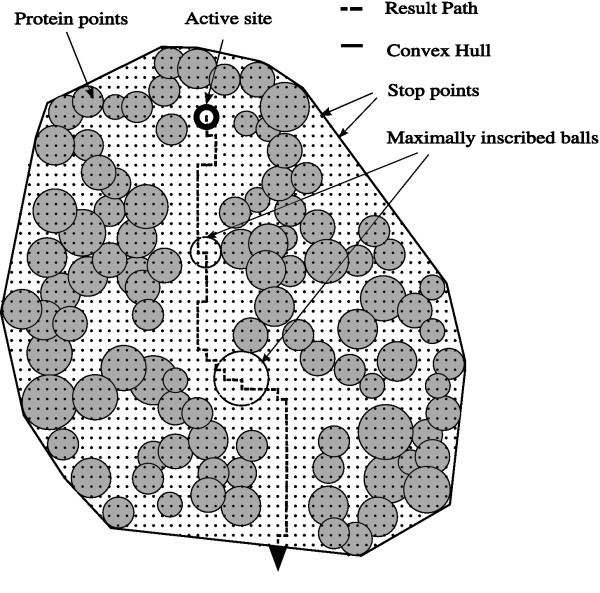
- method uses points on a grid, finds tunnels that minimize an expense function based on proximity to atoms
- relatively fine grid needed to limit errors from grid approximation, but is computationally expensive for large structures (e.g. ribosome), hence MOLE...
For ChimeraX visualization, see:
- ChimeraX recipe for CAVER display
- chimerax-users Apr 2023: size commands to set each radius
- chimerax-users Jul 2021: python script for setting bfactor as radius
- MOLE and
MOLEonline Server,
described in
Petřek et al.,
Structure 15:1357 (2007),
Sehnal et al., J Cheminformatics 5:39
(2013), and
Pravda et al., Nucleic Acids Res
46:W368 (2018).
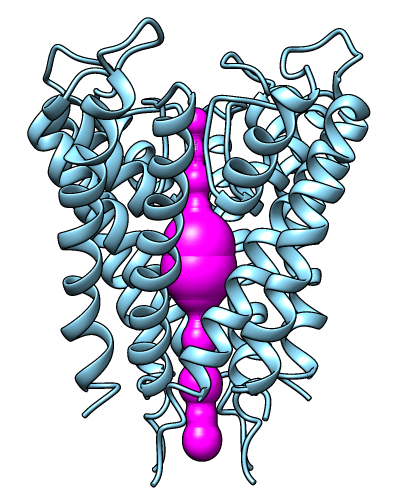
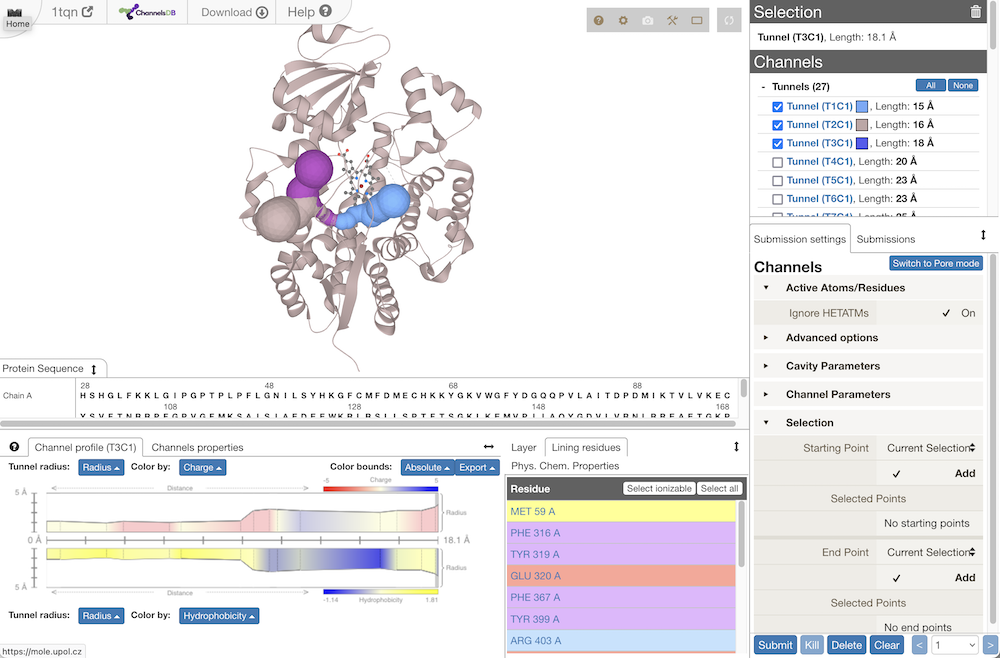
Chimera showing 1bl8 pore from MOLEonline- channels classified into tunnels (cavity → exterior) and pores (exterior → exterior)
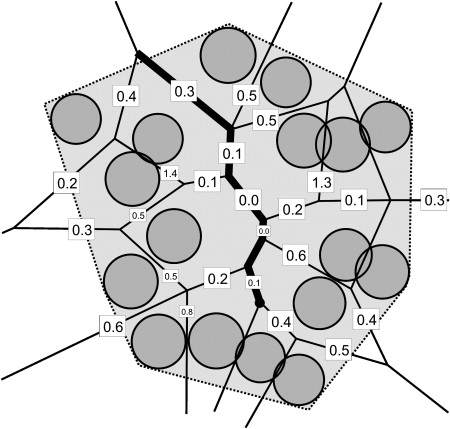
- method uses Voronoi tesselation, finds pathway along Voronoi edges that minimize an expense function (as above)
- each channel is represented by a set of spheres
- web server results
– screenshot
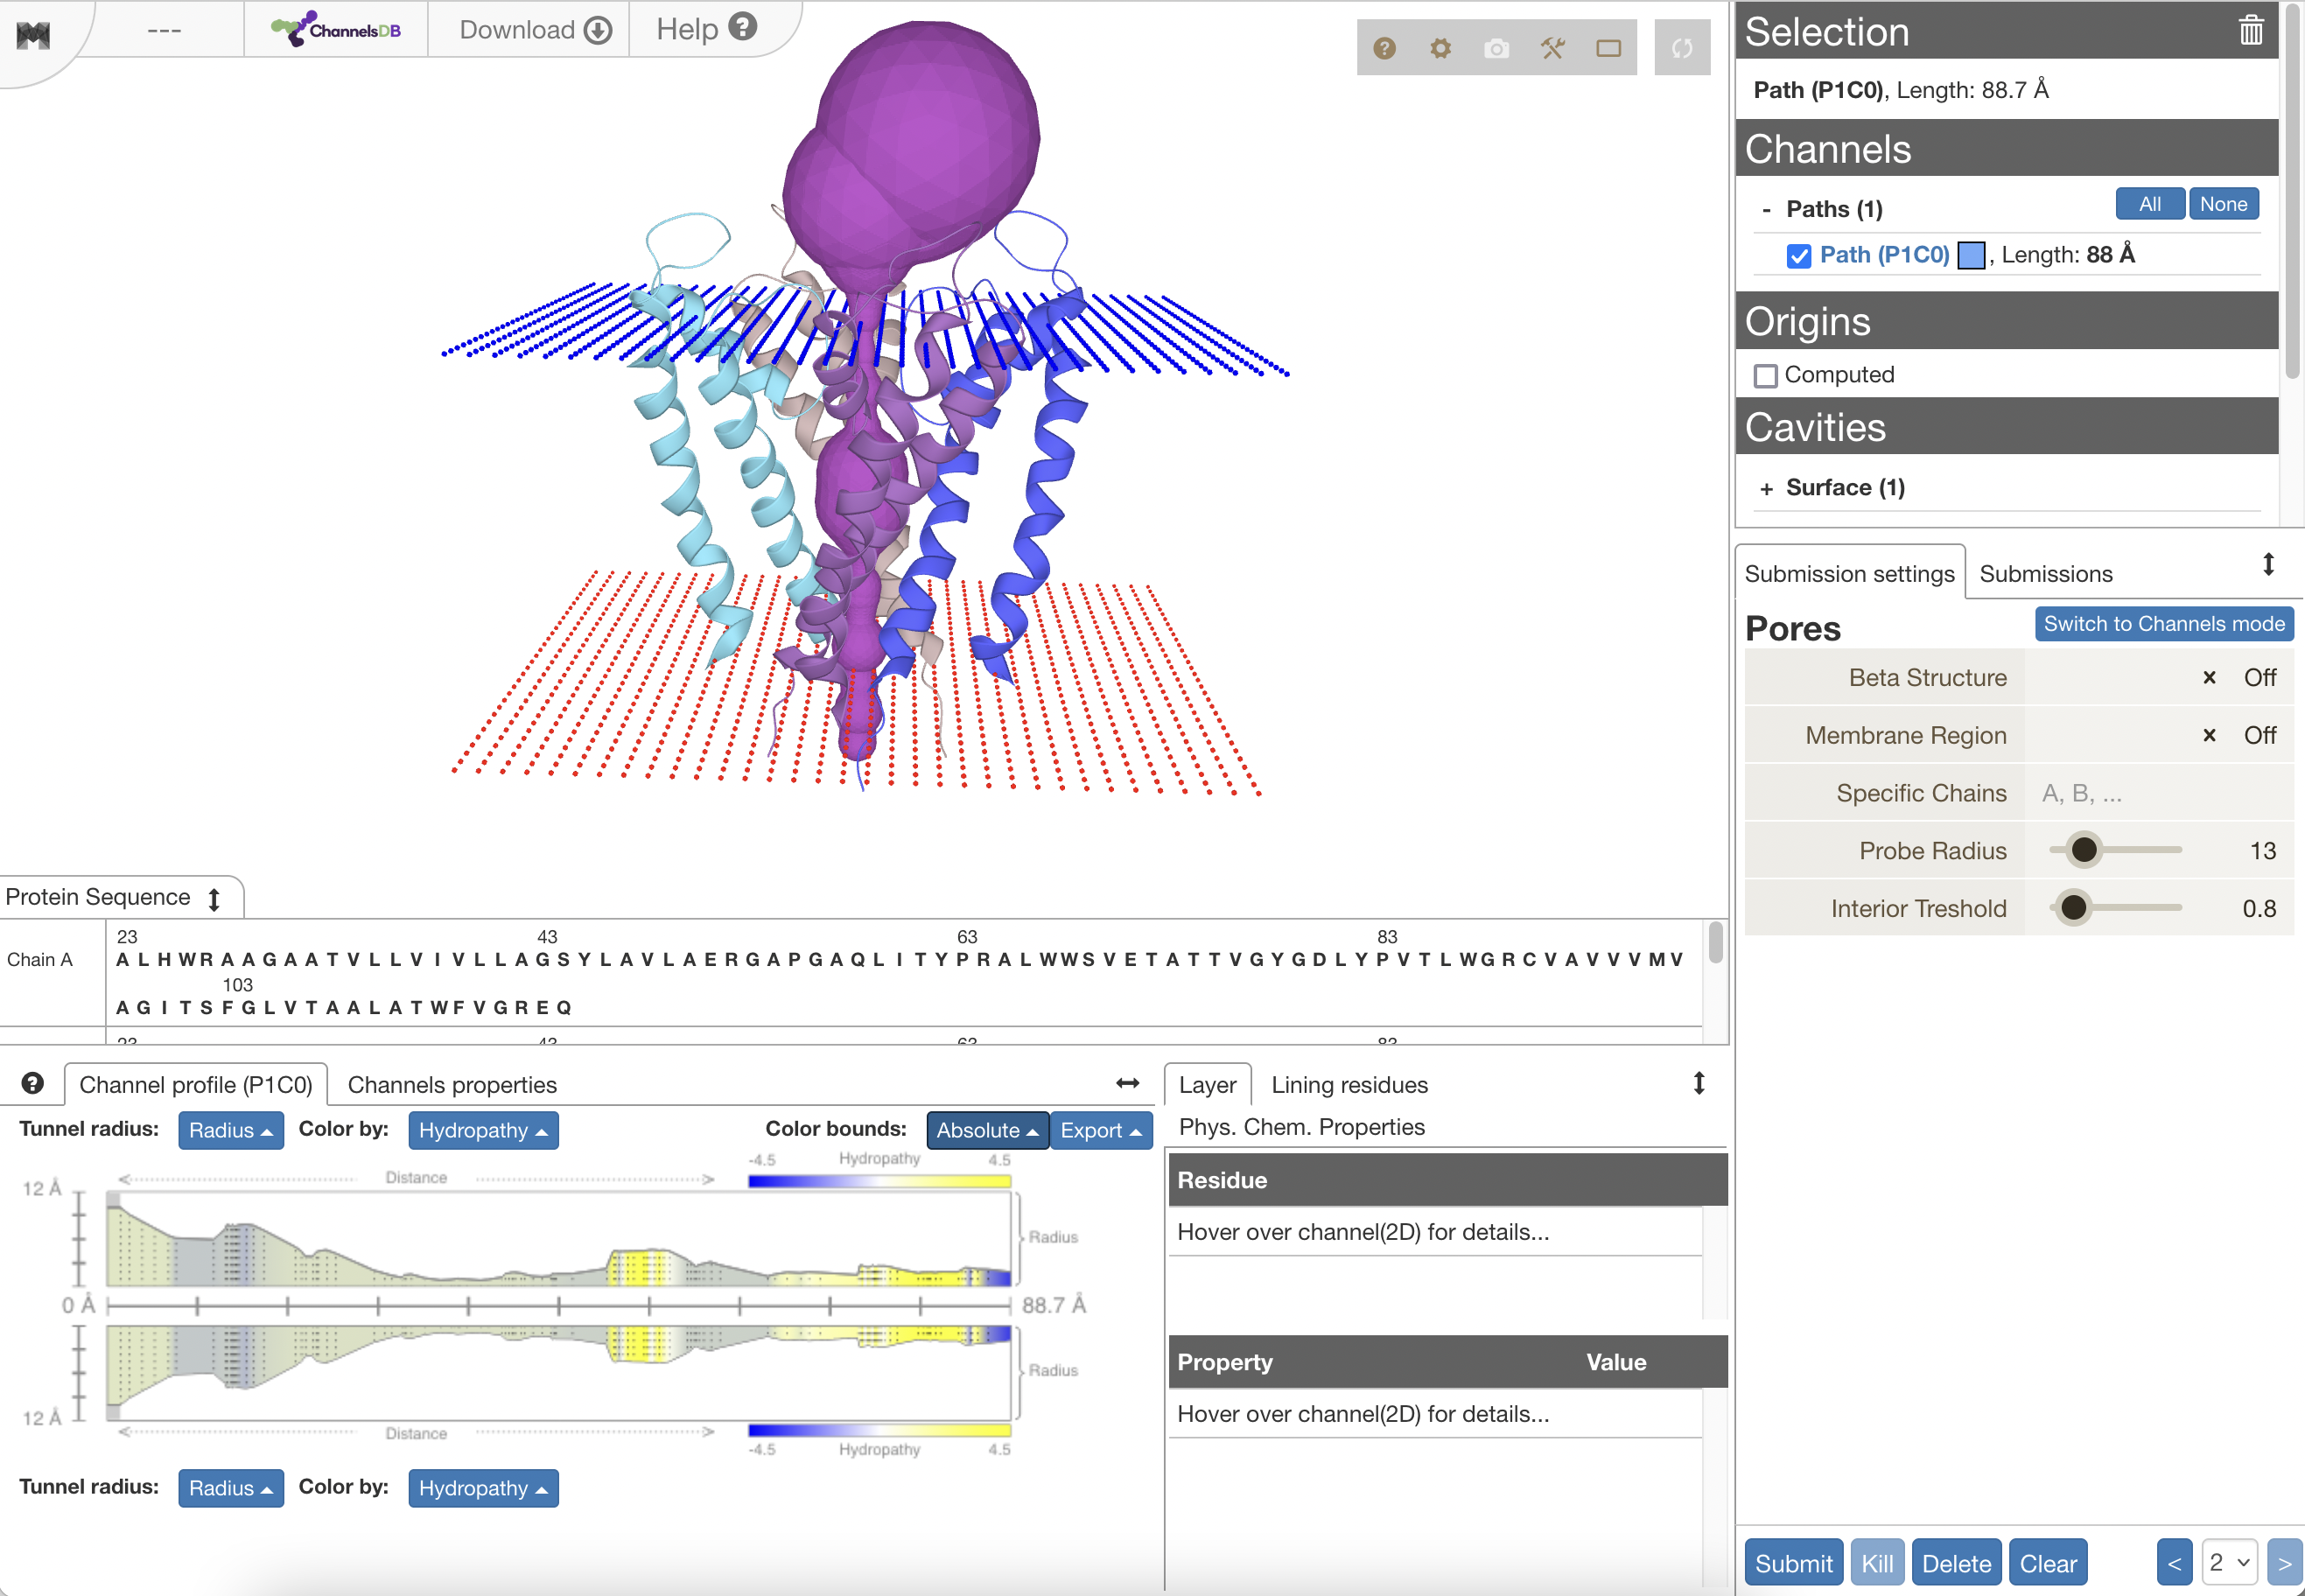
[pore mode example
– screenshot]:
- can show table of properties for all channels, or details for a specific channel: list of residues, profile of some property vs. length (radius, hydropathy, etc.)
- other cavities (open to exterior) and voids (not open to exterior) from Voronoi tesselation are shown as spiky surfaces
- hovering the cursor over a tunnel gives its length and bottleneck radius
- download zip includes scripts for Pymol, VMD, and Chimera
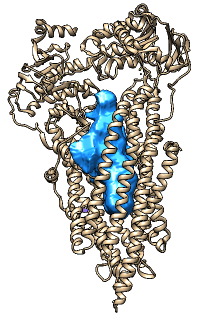
- the Chimera download is a session file with the protein and its channel(s) and cavities – molechannels-1tqn.py
- export from Chimera to ChimeraX omits the cavities (surfaceModel not yet supported) – molechannels-1tqn-export.py
- TomG enhanced ChimeraX to read the “JSON” download and display channels, with slider if more than one – molechannels-1tqn.json, molepore.cxs (hide largest spheres, e.g. hide @@radius>5)
- Pymol and Chimera plugins are GUIs for running standalone MOLE 2.5 (instructions; haven't tried)
- MolAxis server
described in
Yaffe et al.,
Nucleic Acids Res 36:W210 (2008)
and method in
Yaffe et al.,
Protein 73:72 (2008).
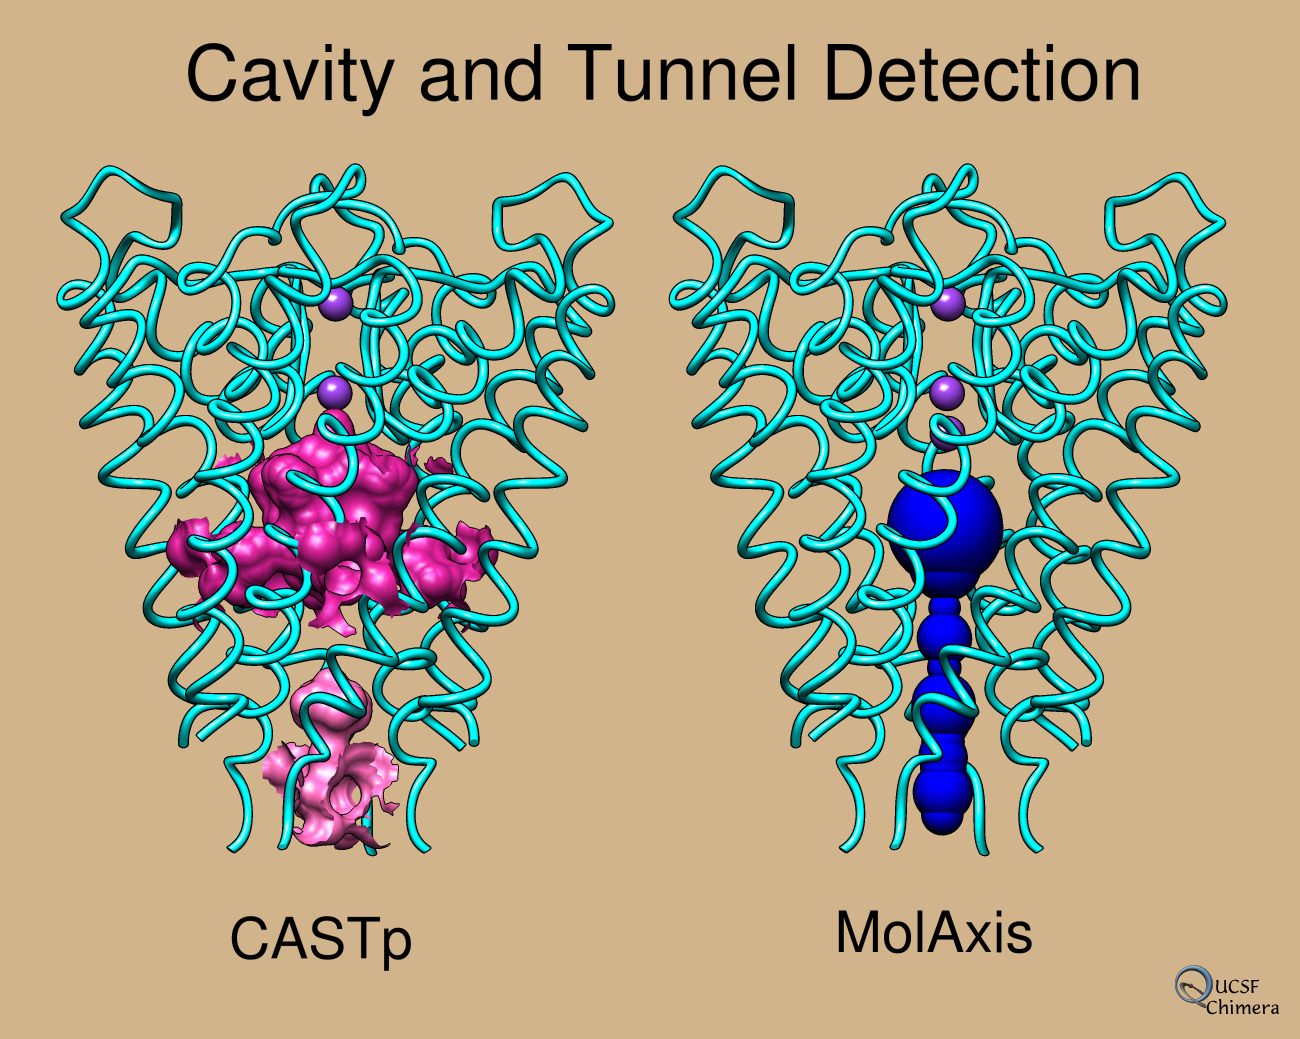
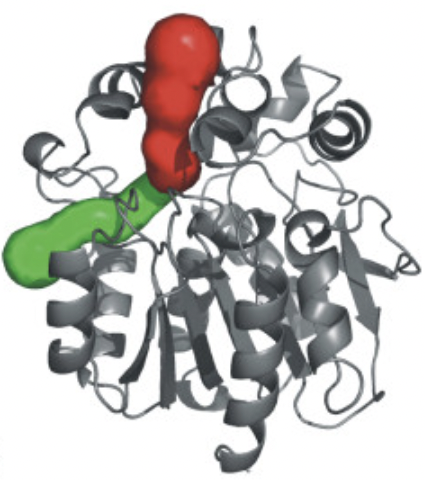
...details in Chimera image gallery- like MOLE, uses Voronoi diagram and is much faster than Caver
- good agreement with HOLE results, paper Figs 2,3
- some novel aspects for faster computation:
- all atoms treated as balls of same size to avoid curved algebraic surfaces
- uses medial axis of molecule-unoccupied space to convert pore-finding from 3D to a 2D problem
- better than MOLE at not giving multiple instances of nearly same channel
- tutorial describes how to view in VMD
- ...and what about CASTp??
Tian et al. Nucleic Acids Res
46:W363 (2018).
It is focused on pocket detection and all kinds of useful measurements
(volume, surface area, circumference, number of openings, etc.).
Visualization is associated but not a strong suit.
- There is a CASTp database and calculation server
- Like MOLE and MolAxis, uses Voronoi tesselation and the related concepts of Delaunay triangulation and alpha shapes (details...)
- Chimera has a CASTp fetch and nice pocket-browser GUI (e.g. open castp:1bl8) but you can see the limitations (from a visualization standpoint) of simply using atomic surface patches
The next two claim to be higher-resolution:
- HOLE, described in
Smart et al.,
J Mol Graph 14(6):354 (1996)
[PDF].

Oliver's example image- finds a possible route for a ball squeezing through the channel, using plane-by-plane Monte Carlo to find largest radius that doesn't intersect with atoms
- better for straighter paths such as ion channels; for more tortuous paths, may produce zigzags and even discontinuous lateral jumps (according to the MolAxis authors)
- I couldn't run ancient binary (32-bit from 2015) and didn't want to deal with source, although it's freely available from github under the Apache-2.0 license
- Oliver Clarke's bash script for visualizing HOLE output in Chimera is described in a previous post (Aug 2015)
- seems popular amongst crystallographers; documentation describes how to view in VMD and Pymol
- Examples in recent publications:
- HOLLOW, described in
Ho and Gruswitz, BMC Struct Biol 8:49 (2008).
- fills cavity with dummy atoms and uses their collective surface
- hrmmm... *was* available at hollow.sourceforge.net, but disappeared just days ago! (Oct 2022)
- fork by Beckstein lab is available on github
This one is a bit different, in that the output is a map:
- 3V: Voss Volume Voxelator
described in
Voss and Gerstein, Nucleic Acids Res 38:W555
(2010).
- uses two-probe “rolling-sphere” method: volume excluded by small probe (~ molecular surface) subtracted from volume excluded by large probe (~ convex hull)
- server generates map files of pocket and channel “void” volumes that can be shown as isosurfaces in Chimera (or ChimeraX or other map visualization software)