Tom Goddard
March 5, 2015
This project develops software for visualizing and analyzing large molecular assemblies such as ribosomes, viruses, and chromosomes, as well as architecture and dynamics of organelles, cells and communities of cells. Phenomenal advances in microscope technologies are revolutionizing our understanding of life processes from 10 nanometer to 10 micron length scales. On the high resolution frontier, electron microscopy is now producing structures of large, rare, and fragile complexes, systems not amenable to X-ray or NMR imaging, with details at an unprecedented resolution of 3 to 4 Angstroms. Most of the molecules of life act in such large transient assemblies and understanding them is a frontier area of molecular biology. At larger size scales, many competing super-resolution optical microscopy techniques have been developed in recent years, capable in some cases of resolving single fluorescently labeled proteins, while other techniques using sheets of light can now image dynamic processes for long time periods without killing cells or loss of fluorescence. Fast microscopes can acquire 1000 two-dimensional images per second allowing acquisition of full 3-d volumes in multiple wavelengths every second. Techniques on the horizon will apply adaptive optics to image deep in living samples.
Software to analyze the hundreds of terabytes of data acquired by one of these cutting edge microscopes lags far behind and is a major bottleneck. Software is needed to explore the data, to analyze it quantitatively, and to visually convey the results. Finding interesting rare structures in very large data sets is often done by a reseacher directly viewing all the data. This requires highly optimized methods to navigate image data as efficiently as possible, data that make take hours simply to read from a disk drive. Analysis is challenging because of the enormous diversity in ways of quantifying observations. Visualizing the results for both scientists and the public is also challenging because of the densely packed environments molecular machines and cells operates in.
In this project we develop new tools within the UCSF Chimera visualization package that support analysis of molecular machines and cells, serving researchers using electron cryo-microscopy single particle reconstruction and tomography, x-ray crystallography, and high-resolution three-dimensional light microscopy. We develop new capabilities to making animations illustrating the architecture and function of molecular assemblies, interpret density maps covering a wide range of resolutions, model structurally heterogeneous assemblies imaged by tomography and light microscopy, and analyse atomic models of assemblies composed of tens to thousands of macromolecules.
Our recent efforts have been focused on visualization of large molecular assemblies such as an HIV virus particle built from tens of thousands of molecules, and viewing and quantifying the motion of immune system cells through networks of collagen filaments using 3-dimensional optical microscopy time series.
|
|
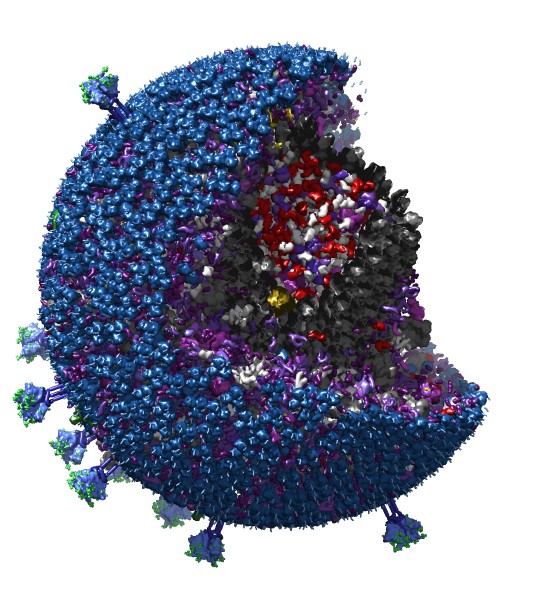
| Figure 1: An HIV capsid model built by cellPACK and displayed by Chimera composed of 20,000 copies of 20 different proteins. |
A key feature of our next generation Chimera 2 software is support for hierarchical molecular models, allowing multiple levels of structure at larger than molecular scales. For instance an HIV virus capsid can be an object composed of a few hundred hexameric and a dozen pentameric capsid protein subunits. The ability to have objects grouped at as many levels as needed is a common feature of 3d animation software but is not in existing molecular graphics packages which focus on small collections of proteins.
For Chimera 2 we have developed graphics capabilities based on the most recent OpenGL 3d graphics library where many graphical operations are programmed to run on the graphics processor. This is essential for visualizing large molecular assemblies with tens of thousands of proteins to enable smooth rotation, cutting out quadrants, selecting and highlighting portions for coloring and measurements. Thousands of instances of the same protein are positioned by a set of matrices in graphics memory, a technique called "instancing", rather than making thousands of separate drawing requests. The modern graphics techniques dramatically speed up drawing outlines around selected molecules by creating the outlines in one pass over the data on the graphics processor while older software uses 5 passes.
Large models created by cellPACK software are now represented in the web standard JSON format and we have made Chimera fetch these files from an online repository of models. Individual proteins are depicted as surfaces using the Collada file format which we now support. The Collada format is able to represent hierarchical structures of any size and we plan to export entire large molecular assemblies in Collada format which can be viewed on the web. In 2014 all of the major web browsers added support for a new 3d graphics library called WebGL and we have developed a prototype viewer that can display and rotate these large HIV models in a web browser.
|
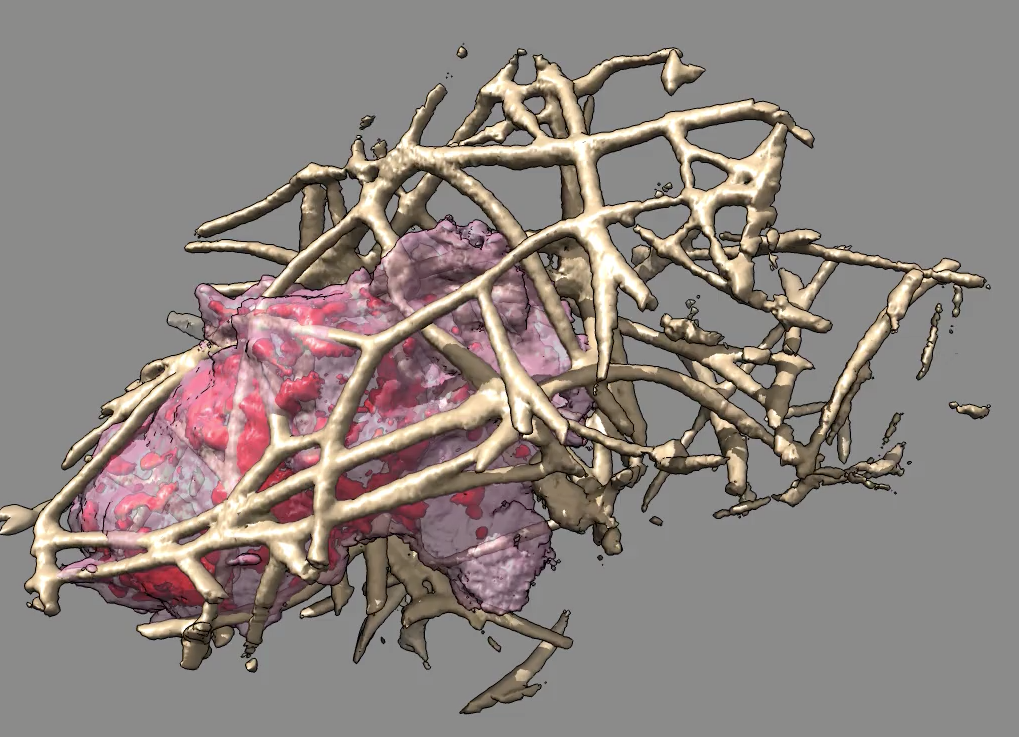
| Figure 2: One time point of 3d optical microscopy of a neutrophil-like cell (the most common white blood cell, responsible for innate immunity), moving through collagen filaments. The network of collagen has been trimmed away computationally for a clear view of just the regions reached by the cell. |
We are working on interactively display large 3d image time series and quantify the observed motions. To get a clear view of immune system cells moving through dense networks of collagen filaments similar to those found in tissues we enhanced Chimera to show only the filaments near the cell. The cell is in motion and we wish to see all of the filaments surrounding the region it traverses. We added capabilities to take the maximum density at each position over a time series and use this with a minimum density cutoff to define the grid points that the cell reaches. Extending that region by some padding distance and masking the separately imaged collagen (labeled with a different fluorophor) shows only the collagen that the cell interacts with (figure 2).
The 3d optical microscopy density is attenuated near the edges of the imaged volume, due to details of the microscope optics (the light sheet is not of uniform thickness). We have tried to correct this attenuation so that cell protrusions and collagen filaments near the edge of the field of view are not distorted. The attenuation can be modeled along one axis, but is unknown along a second axis, with no attenuation along the z axis. So we have tried empirical scaling by envelope functions that the user controls.
We've added basic capabilities to the software to mark the centroid of the cell at each time point to judge the speed and direction of motion. We also added computation of cell inertia axes to estimate the size of the cell along 3 principle axes as a function of time.
Moving cells exert forces on the surrounding collagen filaments and we are looking at the deflections of those filaments to understand how the cell propels itself. To visualize these small slow motions we add short hairs to the rendered filament surfaces indicating the displacement from the current time point to the next time point (typically 1 second apart).
A diverse set of software improvements aimed at improving handling of large density maps, typically from electron, microscopy (EM) and also large molecular structures. With increasing map resolutions the file sizes sometimes exceed 4 billion grid points which is the limit for addressing using 32-bit integer values. We improved our map interpolation code so that rotated subregions from EM tomograms can be extracted from such large maps. We also added a new map format IMAGIC.
Densely packed molecular structures and density maps are sometimes more easily understood when shadows are displayed as they help convey depth. The ambient light striking an object from all directions casts soft shadows making recessed areas dark and is even more effective then shadows from point lights. We implemented several methods for display of ambient shadows and are currently using a generaland simple approach casts shadows from a hundred point light sources uninformly distributed around the model. The difficulty of this implementation is to make the graphics able to cast all these shadows in real-time. We were surpised that graphics processor programming now allows this on mid-range computer systems.
We have improved the performance opening molecular structures, making our next generation Chimera 2 ten times faster, and use three times less memory than previous Chimera versions. This increased performance is vital for studying large molecular structures, and for studying hundreds of variant structures or partial structures of a system of interest. We developed an extension called MultiDomain Assembler to build models large proteins such as fibronectin which consists of 30 domains for which hundreds of homologous structures. The modeling process involves loading those structures and assembling them to choose templates. This capability will benefit from the higher performance of Chimera 2, but it is currently implemented in Chimera 1.
The coming year will focus on a release of our next generation Chimera 2 program. We will develop new graphical user interfaces for display, fitting, and analyzing density maps. using the Chimera 1 methods. These user interfaces will include the best features of Chimera 1 with improvements to make the tools easier to use. A central goal of Chimera 2 is to fully support outside developers of plugins. We will be developing and documenting programming interfaces to density map data structures and algorithms to meet this aim.
We will continue develop and release a web browser map time series application. We will add the ability to trace paths in the data. Currently only spherical markers can be placed. To allow a researcher to easily put data online, we plan to make a standalone server program that they can run on the machine where the data resides. Web browsers can then display and annotate that data. This will be tested as part of our driving biomedical project with data from Dyche Mullins' lab. We will experiment with enabling more sophisticated algorithms in the web browser such as tracking part of a moving cell starting from an placed marker. We will first try this on our desktop app using Python or C++ code and will try using translators to use the same code in the Javascript language required by web browsers.
We plan to try interactive display of large molecular assemblies and electron microscopy data on a planetarium dome. We have made prerecorded videos in the past but now want to show the data with live control by the presenter as is done in astronomy planetarium shows. We will test this new Chimera capabilities with dome equipment and data from our driving project with Wah Chiu's lab.
Many labs are now producing 3-4 Angstrom resolution electron microscopy maps and molecule models fit into those maps. The molecules are typically large (thousands of residues) and the maps often have resolution that varies based on how flexible each region of the structure is. We plan to explore capabilities to quickly visualize how well the molecular models fit in different regions of the density. This is typically done with zone and slab display of the density. We will try to do "smart clipping" that displays regions of density cut off where the weakest linking density occurs, instead of being cutoff exactly at a plane or a fixed distance as done with existing tools. We will develop this with collaborators Wah Chiu and Adam Frost.
We will try to extend our work on ambient occlusion lighting to give better quality and faster rendering on smooth surfaces which are common when viewing density maps. Our current method with even 100 to 200 cast shadows leads to a mottled appearance on smoothly curving surfaces. We believe the ambient shadowing can be made more realistic and faster by computing the dimming on a 3-dimensonal grid and then smoothly interpolating those values. This will avoid the sharp edges produced by individual cast shadows. The implementation will use OpenGL 3d textures which will be 5 to 10 times faster than the current code that uses many lookups in a large 2d texture (one for each shadow cast).