Tom Goddard
Sept 10, 2015
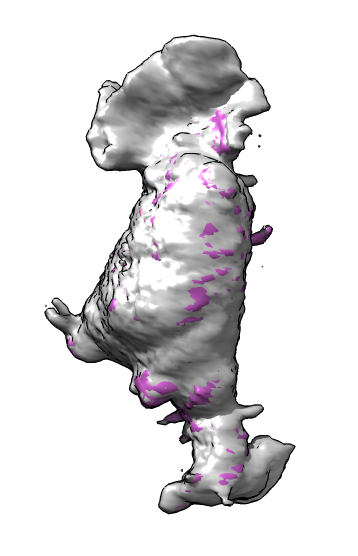
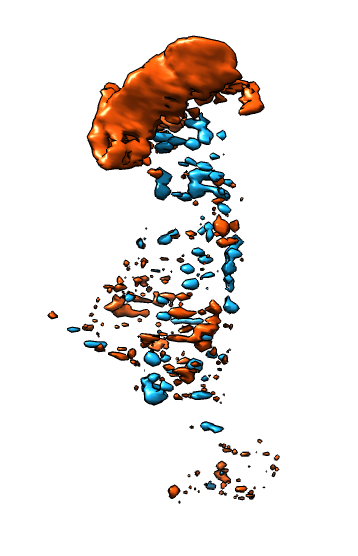
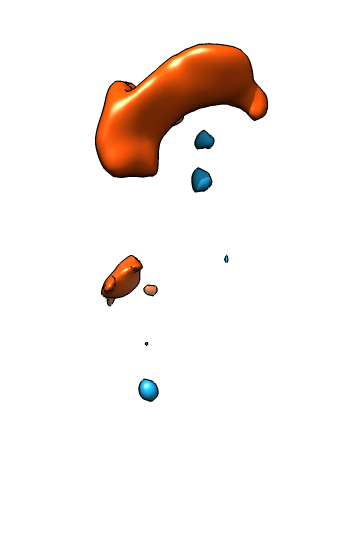
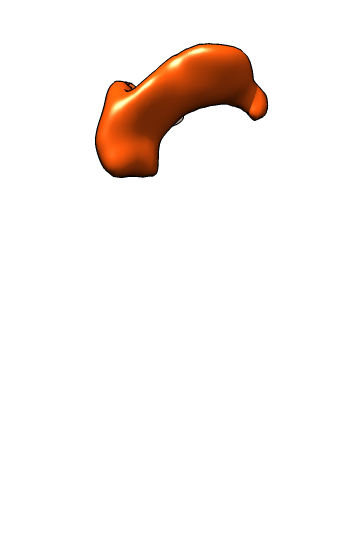
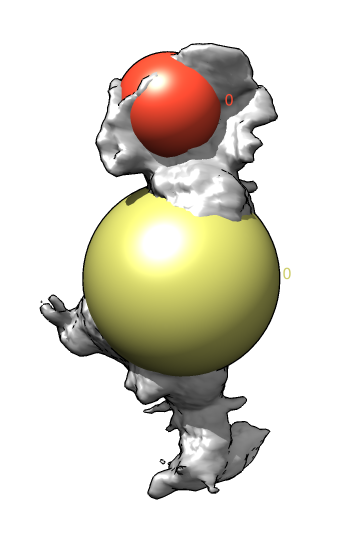
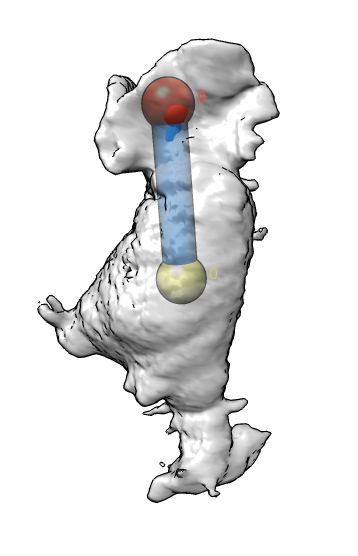
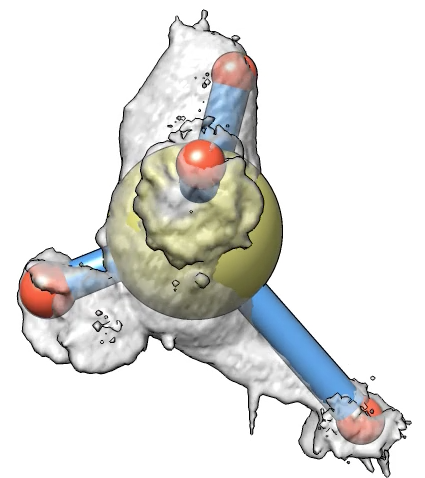
Here is a method to mark cell protrusions in crawling neutrophils seen in 3d optical microscopy time series. It uses actin and membrane labeled channels and that the actin label does not go into the protrusions. Taking a difference map of membrane minus actin only the protrusions remain plus noise. We smooth the result to reduce the noise, then call each connected contour surface piece that encloses a sufficiently large volume a protrusion. Protrusions are marked with spheres that are shown connected to a central sphere representing the cell. The sphere volumes are made to match the volumes of the protrusions and volume of the cell.
Tested on cell 15 (BEAMMEUP/Actin_Membrane_3D/03042013_cell10).
|
|
|
|
|
|
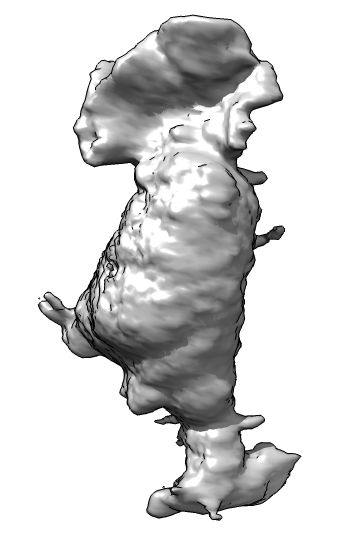
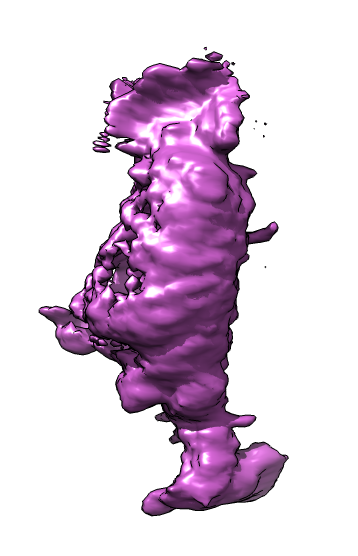
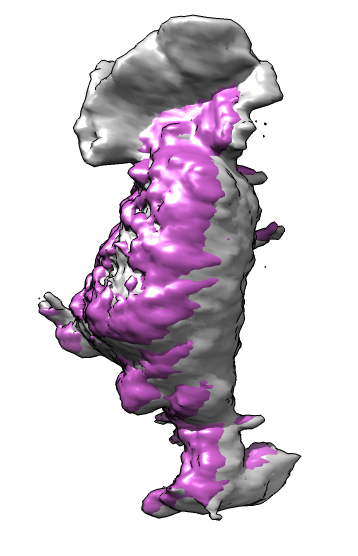
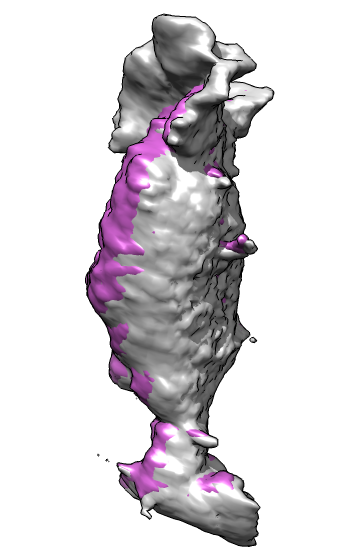
| Membrane | Actin | Both channels | Imperfect alignment | After fit |
| 
| 
| 
| 
|
| Difference map (positive orange, negative blue) | Smoothed difference | Hide dust | Mark protrusions | Constant size spheres |
Movie with Marked ProtrusionsMovie showing marked protrusions over 250 frames of cell 15 motion. This used Gaussian smoothing standard deviation 0.5 microns, detection threshold 85, and minimum protrusion volume of 10 micron**3. Second movie uses reduced minimum volume of 5 micron**3. | 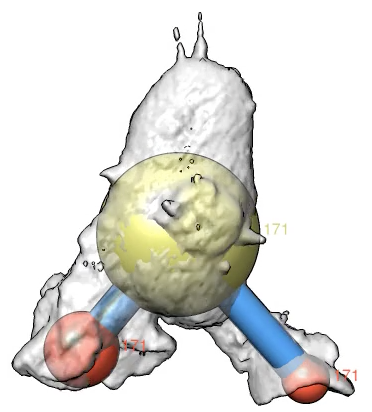
| 
|
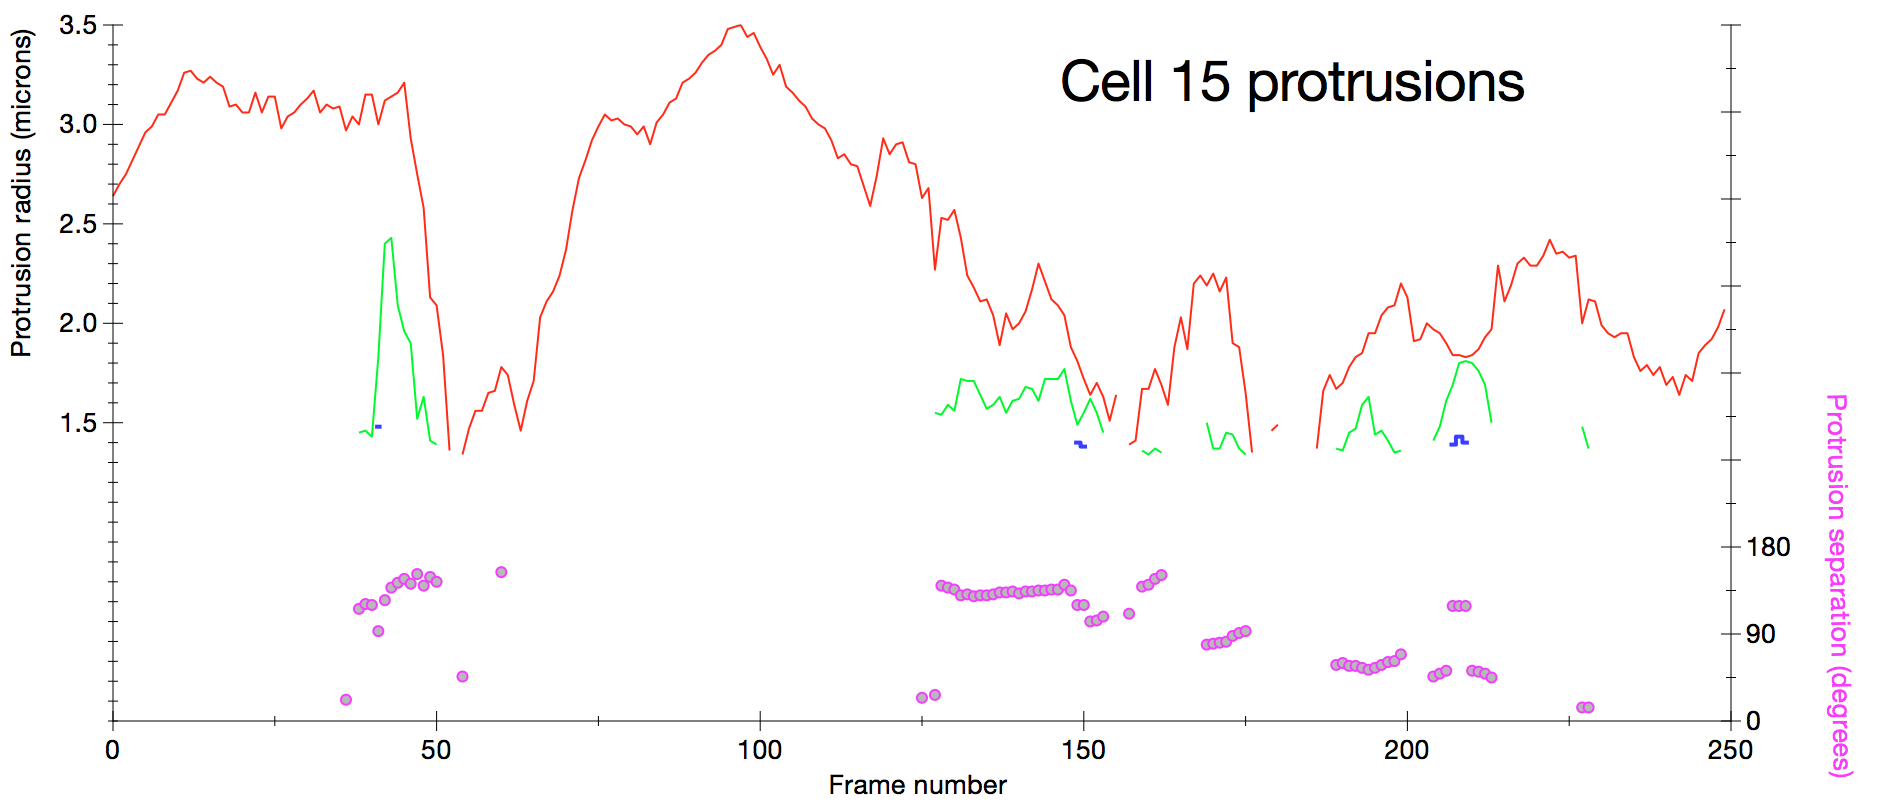
Plot of protrusion size measured as sphere radius for sphere with volume matching protrusion volume seen in smoothed difference map. Red, green and blue curves are the largest protrusions ordered by size. Separation of protrusions is measured (pink circles) as the average angle between cell center to protrusion center vectors.
The Python script protrusions.py was used with Chimera 1.11 daily build to produce the images, movie, and plot data.