| 
|
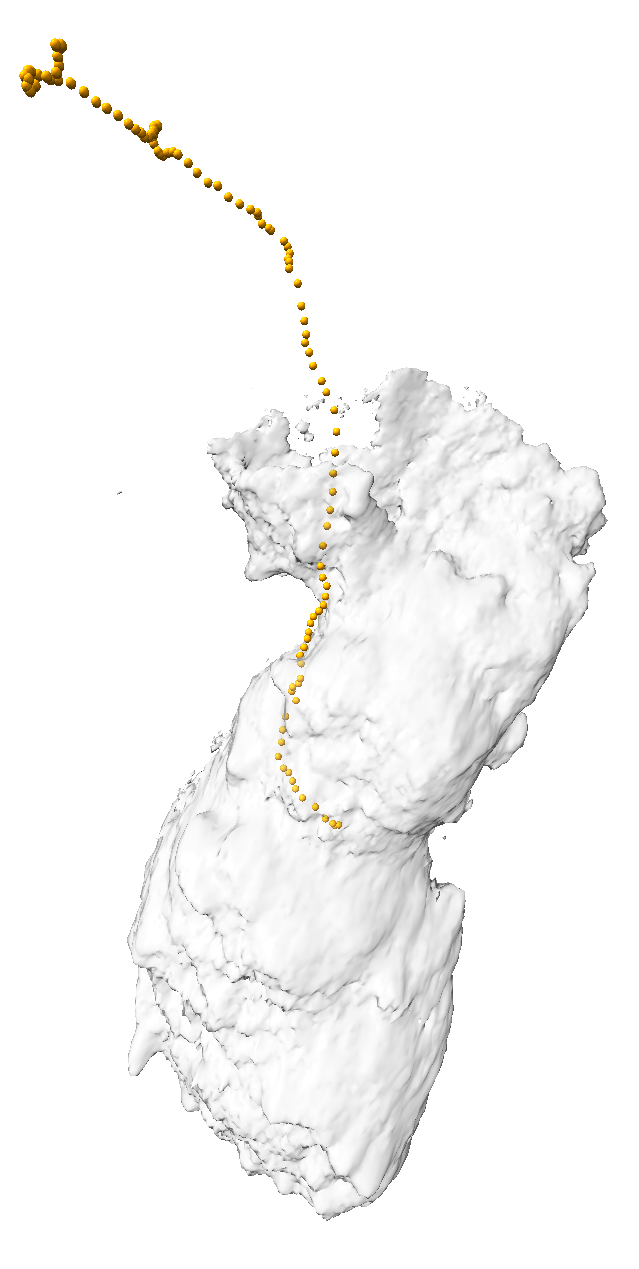
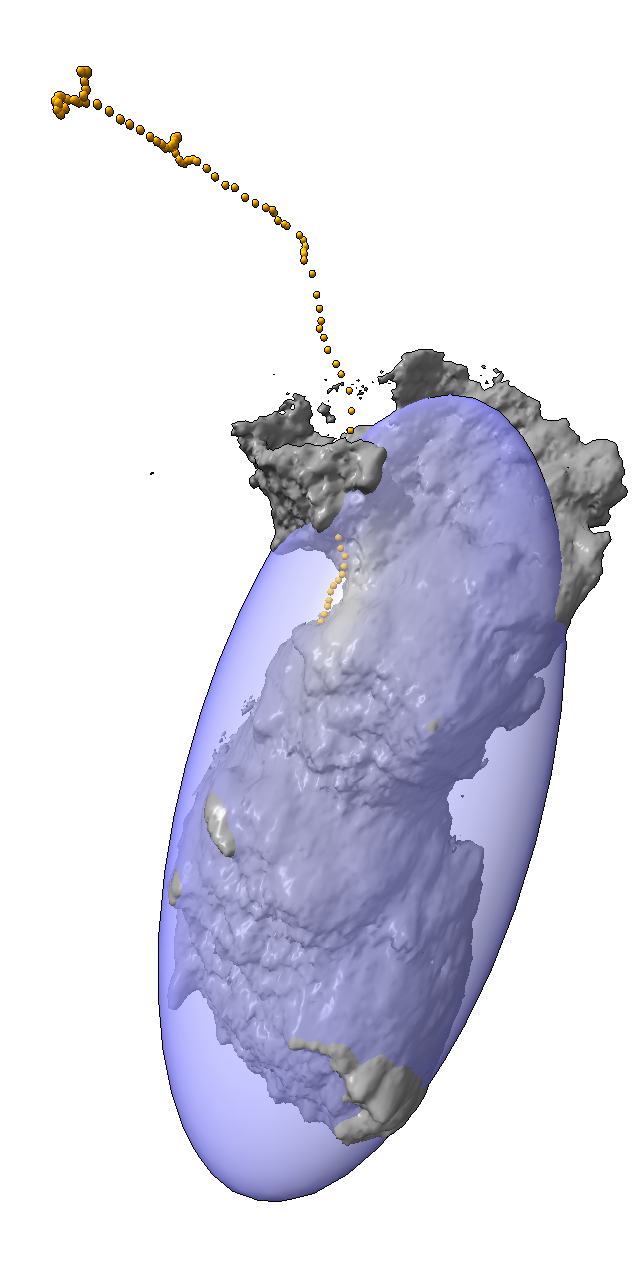
| Centroids and initial cell position | Inertia ellipsoid for initial cell position |
Tom Goddard
October 7, 2014
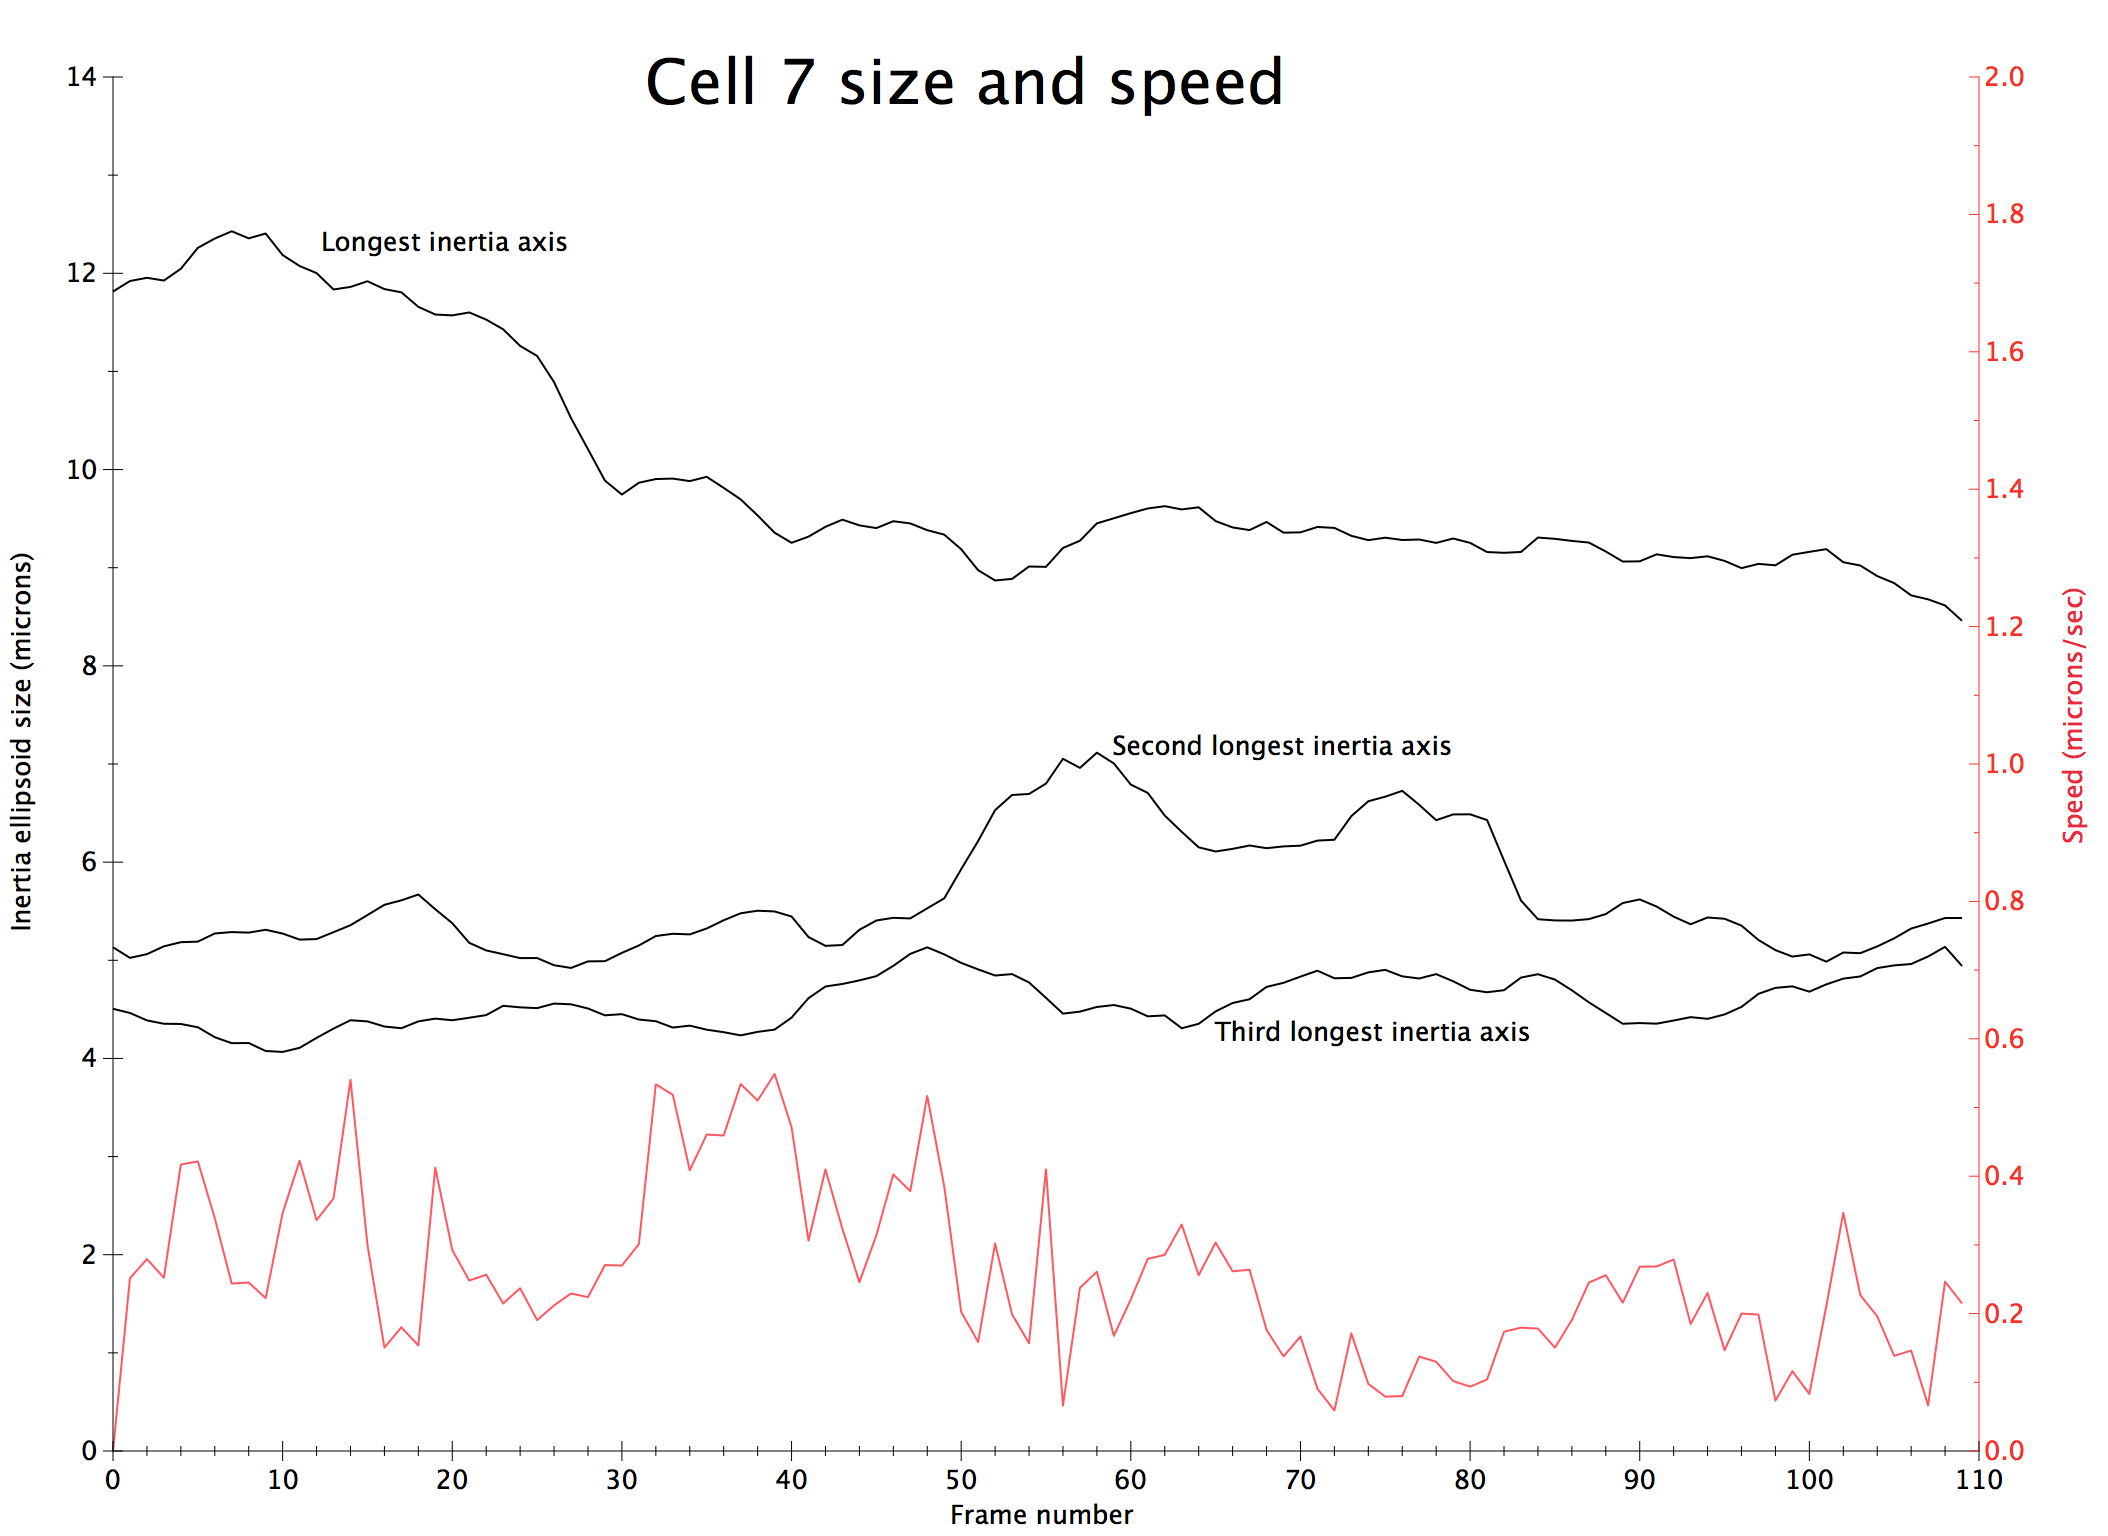
Examine whether speed of cell motion is correlated to changes in cell size. For instance, does the cell contract or expand along its long axis when it is travelling fast?
Hard to draw conclusions, only examined one data set, duration of motion is short, speed is noisy possibly due to renormalization of maps needed because of deconvolution changing normalization of each frame in a different way.
|
|
|
Size of cell is approximated by computing principle axes and principle moments of inertia of density map above a specified threshold level. The plotted sizes are the size of a uniform density equivalent ellipsoid aligned to the principle axes.
Compute center of mass position and length of 3 principle inertia axes for each frame of cell motion map series. Used cell7 actin labelled (march 22, 2013) aligned to remove drift.
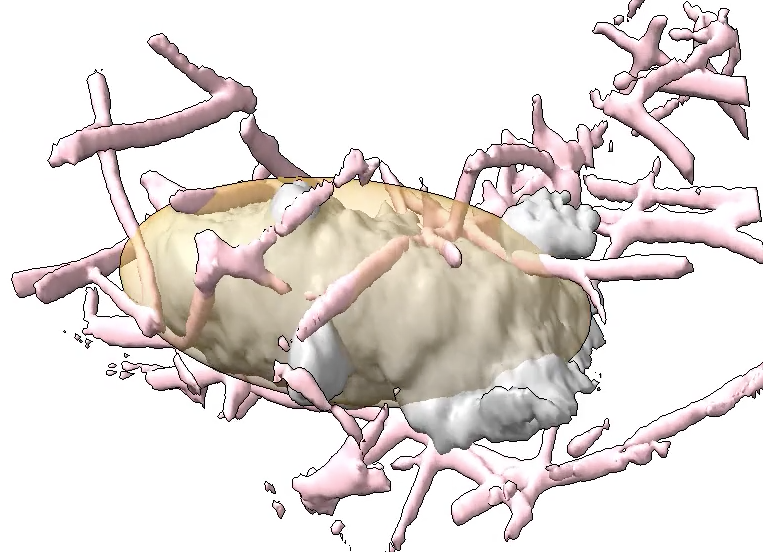
Movie showing brown inertia ellipsoid approximating cell.
Speed is the distance between one frame cell centroid and next frame cell centroid. Approximate interval between frames is 1 second (used exactly 1 second in above plot).
Used Hydra "vseries measure" command. The Chimera version of this command does not have the inertia ellipsoid calculation. Hydra also has the "measure inertia" command which computes the mass-weighted inertia for density maps (only surface area weighted version available in Chimera).
Example output from vseries measure command:
# Volume series measurements: cell7_ch1_align.cmap
#   n        level         x            y           z           step       distance       volume        area         inertia ellipsoid size
    0       100.47       14.975       28.028       14.616            0            0       501.86       1287.3       11.814       5.1325       4.5056
    1       100.47       15.123       28.203        14.72      0.25147      0.25147       505.74       1116.8       11.921       5.0246       4.4632
    2       100.47       15.021       28.392         14.9      0.27933      0.53079       509.19       1136.2       11.954       5.0626       4.3875
    3       100.47       14.832       28.552       14.944      0.25227      0.78306       506.31       1153.4       11.926       5.1422       4.3533
    4       100.47       14.502       28.777       14.822      0.41694          1.2       507.85       1139.4       12.046       5.1843        4.351
    5       100.47        14.12       28.945       14.767      0.42152       1.6215       505.72       1052.8       12.259       5.1902       4.3178
    6       100.47       13.936        29.23       14.775      0.33879       1.9603       507.99       1026.1       12.354        5.273       4.2162
    7       100.47       13.836       29.448       14.732      0.24372        2.204        510.5       997.78       12.428       5.2876       4.1555
    8       100.47       13.711        29.64       14.646      0.24529       2.4493       512.15       1056.7       12.356       5.2818        4.157
    ...
Plot was made with Mac plotting program called Abscissa.