
The Structure Measurements panel has three sections shown as index cards:
Save saves measurements to a file. Close closes the measurements panel, and Help opens this manual page in a browser window.
The Distances section of Structure Measurements is a table of distance monitors (measurements that update if there are changes). See also: distance
There are several ways to start Distances, a tool in the Structure Analysis category. Distance monitors can be created in three ways:
| Distances - simple atom listings |
|---|
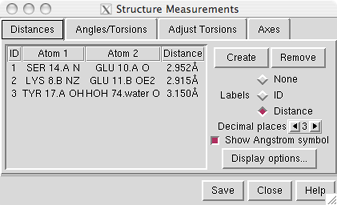 |
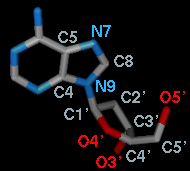
Atoms can be listed in a simple style consisting of residue name, residue specifier (number.chain), and atom name, as shown in the figure, or with command-line specifiers (see the Adjust Torsions figure). Atomspec display style in the General preferences controls which style is used.
The distance list can be sorted by the values in any column by clicking the header. Clicking the header once sorts the entries in order of increasing value and places an up arrowhead (triangle) in the header. Clicking again sorts the entries in decreasing order and places a down arrowhead (inverted triangle) in the header.
A distance monitor can be chosen by clicking on its line, and more than one can be chosen at a time. Chosen lines are highlighted in the dialog. Ctrl-click toggles the status of a line, while clicking on the first (or last) line of a contiguous block and then Shift-clicking on the last (or first) chooses all of the lines in the block.
Choosing a distance listing selects the corresponding distance pseudobond. Remove deletes the chosen distance monitors. If there is only one, it is not necessary to choose it before using Remove.
The Labels setting applies to all distance monitors and can be switched among:
The lines drawn to represent distance monitors are pseudobonds in a group named distance monitor. Clicking Display options... brings up a list of pseudobond attributes for this group, allowing changes in properties such as color, linewidth, and whether the lines are dashed. When an individual pseudobond is selected, its attributes can be altered with the Selection Inspector.

The Angles/Torsions section of Structure Measurements is a table of angle monitors (measurements that update if there are changes). A "bond angle" is measured for three atoms and a "torsion angle" for four atoms; however, it is not necessary for the atoms to be contiguous or even bonded to one another. Angles/Torsions reports changes but cannot be used to change the angles. To modify torsions, use Adjust Torsions instead.
There are several ways to start Angles/Torsions, a tool in the Structure Analysis category. Angle monitors can be created in various ways:
Clicking on a listing allows it to be deleted with the Remove button. If there is only one angle monitor, it is not necessary to click on its listing before using Remove.
The Decimal places setting controls how angles are reported in the table; the number of digits shown after the decimal can be changed by clicking or holding down one of the arrows on either side of the value.
The command angle can also be used to measure bond angles and torsions; however, it yields a static measurement rather than a continuously updating monitor.

The Adjust Torsions section of Structure Measurements is a table of active (rotatable) torsions. See also: Rotamers, swapaa
There are several ways to start Adjust Torsions, a tool in the Structure Editing category. Torsions can be activated in several different ways:
| Adjust Torsions - command-line specifiers |
|---|
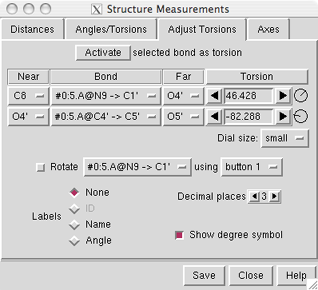 |
Atoms can be described with command-line specifiers, as shown in the figure, or in a simple style consisting of residue name, residue specifier (number.chain), and atom name (see the Distances figure). Atomspec display style in the General preferences controls which style is used.
If the four atoms defining a torsion are called 1-2-3-4, 1 is the Near atom and 4 is the Far atom, which will move when the bond is rotated. The angle in degrees as defined by the current Near and Far atoms is shown in the Torsion column. Torsion can be toggled to Delta; the reported value is then the angle in degrees relative to the starting angle, and there are no Near and Far columns.
 A bond can be rotated by entering a new angle value (and pressing return),
clicking the arrows flanking the angle value,
or manipulating the dial. The Dial size can be set to
small, medium, or large. Further, torsions
can be manipulated in the graphics window with the mouse.
This can be done by checking
Rotate [torsion] using [button]
and choosing the desired torsion and mouse button from the pulldown menus.
A bond can be rotated by entering a new angle value (and pressing return),
clicking the arrows flanking the angle value,
or manipulating the dial. The Dial size can be set to
small, medium, or large. Further, torsions
can be manipulated in the graphics window with the mouse.
This can be done by checking
Rotate [torsion] using [button]
and choosing the desired torsion and mouse button from the pulldown menus.
The Bond column contains a pulldown menu for each active rotation, labeled with identifiers for atoms 2->3 (those flanking the rotatable bond):
When atom 2 is bonded to more than two atoms, there is more than one possible Near atom, and alternatives (if any) are available in a pulldown menu from the current Near atom name. Likewise, when atom 3 is bonded to more than two atoms, there is more than one possible Far atom, and alternatives (if any) are available in a pulldown menu from the current Far atom name. For the first torsion in the example (figures above), there are two choices for the Near atom, C8 and C4, and two choices for the Far atom, O4' and C2'. For the second torsion, there are two choices for the Near atom, O4' and C3', and only one possible Far atom, O5'. Of course, if Reverse is used, the Near and Far choices are interchanged, and in the Delta mode, there are no Near and Far columns.
The Labels setting applies to all active torsions and can be switched among:

The Axes section of Structure Measurements is a table of axes defined for protein helices and/or other sets of atoms. Axes are displayed in the graphics window as rods. See also: PipesAndPlanks
There are several ways to start Axes, a tool in the Structure Analysis category. Clicking Define axes... opens a dialog for specifying atom sets and other axis parameters:
The table of axes lists Name and Length, and entries can be sorted by either column by clicking the header. The length of an axis is that needed to span the projections of the defining atoms back onto the axis. Individual axes can be hidden and shown using the Shown checkboxes.
An axis can be chosen by clicking on its line, and more than one can be chosen at a time. Chosen lines are highlighted in the dialog. Ctrl-click toggles the status of a line, while clicking on the first (or last) line of a contiguous block and then Shift-clicking on the last (or first) chooses all of the lines in the block.
Choosing two axes reports their crossing angle and closest distance (treating the axes as infinitely long) below the table and in the Reply Log. Optionally, choosing axes also:
Delete removes the chosen axes. In addition, closing a molecule model or deleting atoms removes any axes defined using those atoms.
Axis information written out with Save includes name, length, and untransformed position in terms of center coordinates (xc,yc,zc), and orientation expressed as a unit vector (xu,yu,zu). Axis endpoint coordinates (x1,y1,z1) (x2,y2,z2) can be generated as follows:
x1 = xc − 0.5(length)(xu)
y1 = yc − 0.5(length)(yu)
z1 = zc − 0.5(length)(zu)
x2 = xc + 0.5(length)(xu)
y2 = yc + 0.5(length)(yu)
z2 = zc + 0.5(length)(zu)