 |
There are several ways to start Morph Map, a tool in the Volume Data category (including from the Volume Viewer Tools menu).
The map files will be listed as choices if they have already been opened (from Volume Viewer or otherwise), or they can be located and opened with Browse.
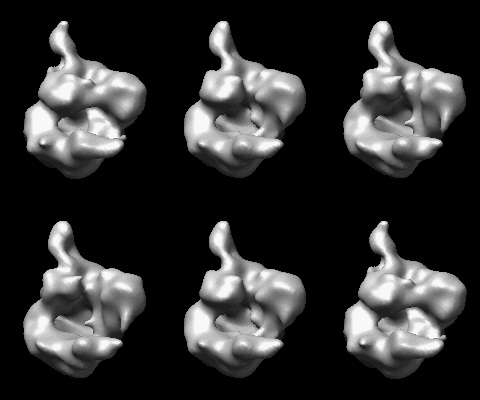
Moving the Fraction slider generates the corresponding interpolated state. At a fraction of zero, the interpolated map is the same as the First map, and at a fraction of 1, it is the same as the Second map. Interpolation creates a new data set (Writable copy...) for which display parameters (threshold level/color, surface smoothing, etc.) can be adjusted in Volume Viewer to control the appearance of the morph.
D1(1–fraction) + D2(fraction)calculate intermediate values with:
D1 + D2(fraction)This treats the second map as a delta to be applied to the first map. For example, the second map could represent normal mode fluctuations of the first map.