
Benchmark measures graphics card and CPU performance on standard Chimera rendering tasks. It facilitates comparisons among hardware systems, and for users with access to different systems, indicates which will give the best performance with Chimera. The standard tasks include rendering volume data (a cubic grid of numbers) and molecules.
The Chimera web site includes a table of results for different computer systems. You can send your results and system description to chimera-dev@cgl.ucsf.edu to have them added to the table.
There are several ways to start Benchmark, a tool in the Utilities category. For accurate results, any models open in Chimera should be closed and any other processes running on the system should be halted before benchmarks are run. Other windows should not be placed on top of the Chimera graphics window during benchmark calculations. The top part of the Benchmark panel contains explanatory text. When benchmark calculations are run, the results are appended to this text. Close dismisses the Benchmark interface, and Help opens this manual page in a browser window.
Most of the buttons in the Benchmark interface pertain only to volume rendering. The buttons in the first row under Run benchmark initiate volume data benchmarks:
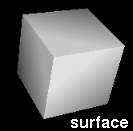
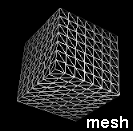
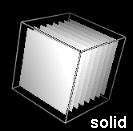
The models are drawn to an internal buffer and not actually shown in the Chimera graphics window. Pressing one of the buttons under Show standard model will open the specified model type (surface, mesh, or solid) of the specified size in the graphics window. Depending on the size and viewing angle, a solid model may look like a stack of planes; this is an artifact of the rendering procedure. The models can be closed with the Model Panel or the command close.
|
|
|
The Measure frame rate buttons report the frame rate for the current display. The benchmark results are based on the ideal frame rate; unlike the actual frame rate, the ideal rate does not include the fixed delay introduced by Chimera or effects from synchronization of OpenGL drawing with monitor refresh. Monitor actual frame rate reports the rate every second.
Clicking the molecule benchmarks button runs the molecule benchmark calculations. None of the other buttons (including Halt) will be responsive while the molecule benchmarks are running. Structures of increasing size (1gcn, 1yti, 2gbp, 1got, 2hmg, 2pda, 1ynj, and 1f4h) are opened and shown in various representations. The values reported are:
Chimera window comes to top. When the Chimera graphics window is covered by other windows, some systems will shortcut the drawing process. Running any of the benchmarks brings the graphics window to the top.
Timing method. The benchmark timings use wall clock time (the Python time.time() call) instead of CPU time (Python time.clock()) because the latter does not measure the time used by the graphics card.
Molecule benchmarks unstoppable. The molecule benchmarks cannot be halted.
Insufficient memory. The solid volume benchmark can run out of memory on a machine with fast graphics relative to main memory size.
Convergence method. Iterative bisection is used to find the 10 fps size for volume data. An alternative is to get the time for a given size and use a scaling law. However, there is no simple relationship between rate and data size; pixel fill rate, number of primitives, texture memory size, and CPU cache size can all cause hard-to-predict scaling behavior.