This tutorial demonstrates many uses of attributes, or properties of atoms, residues, and molecule models. Attributes can be numerical (such as atomic number), boolean (e.g., whether a residue is an alpha-helix), or string-valued (such as atom type). Attribute values can be rendered visually and used in selection and command-line atom specification.
Part 1 uses a leucine zipper structure, and Part 2 uses the structure of a GTP-binding protein.
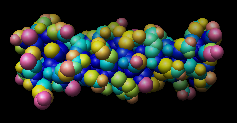
| 1zik colored by accessibleSurface |
|---|
|
On Windows/Mac, click the chimera icon; on UNIX, start Chimera from the system prompt:
unix: chimera
A basic Chimera window should appear after a few seconds. Open the Command Line (choosing Tools... General Controls... Command Line is one way) and, if desired, the Side View for clipping and scaling.
If you have internet connectivity, structures can be obtained directly from the Protein Data Bank. Choose File... Fetch by ID from the Chimera menu. In the resulting dialog, check the PDB ID option (if it is not already checked) and fetch the PDB structure 1zik. If you do not have internet connectivity, download the file 1zik.pdb included with this tutorial and use File... Open to open it.
The structure is a leucine zipper formed by two peptides. Undisplay water, change to a stick representation, and color by element:
Command: ~disp solvent
Command: repr stick
Command: color byelement
Move and scale the structure as desired throughout the tutorial.
Open the Render by Attribute tool (Tools... Structure Analysis... Render by Attribute). It is initially set to show the attributes of atoms. Look in the Attribute list to see the attributes available: bfactor and occupancy, which were read from the input PDB file. Choose bfactor; a histogram of the values will appear, with blue, white and red markers (or thresholds). Click Apply to color the atoms blue to white to red in order of increasing B-factor. You can define your own color mapping by adding and deleting thresholds (Ctrl-clicking an existing one deletes it; Ctrl-clicking elsewhere on the histogram adds one), moving them along the histogram, and/or changing their colors. The Value and Color are shown for the most recently clicked or moved threshold. The Value changes when the threshold is moved, or the position can be changed by entering a value and pressing return. The Color can be changed by clicking the adjacent color well. If you wish, try applying different color mappings. As expected, the atoms with higher B-factors are on the outside of the structure. Note that the histogram includes the B-factor values of the waters even though they are not displayed. Display waters with B-factors less than 75:
Command: disp solvent & @/bfactor<75
Next, change to the attributes of residues in the Render by Attribute dialog. The automatically available attributes are kdHydrophobicity and average bfactor and occupancy. The latter two are residue averages over the atomic values. Choose kdHydrophobicity, the Kyte-Doolittle hydrophobicity values of amino acid residues: negative values correspond to more polar residues and positive correspond to more hydrophobic residues. Undisplay atoms and show a ribbon:
Command: ~dispApply any coloring scheme you like to show kdHydrophobicity. We will also show this property with "worms." In the Render by Attribute dialog, change from Colors to Worms. The values are still shown in a histogram, but now the thresholds have a Worm radius instead of a color. The thresholds can be added, deleted, and moved like before, and the Worm radius can be changed. Change the mapping as desired and then click Apply. The worm "fatness" (along with the previously applied coloring) shows that the most hydrophobic residues tend to face the interior of the structure. To return to a normal ribbon instead of the worm, change Worm style to non-worm and click OK (which is equivalent to Apply plus Close).
Command: ribbon
Other hydrophobicity scales (besides Kyte-Doolittle) are available as attribute assignment files.
Next, use Surface Area/Volume* to calculate surface area; the area per atom will be loaded automatically as an attribute. In this case, we will focus on numerical results instead of changing the display. Choose Tools... Surface/Binding Analysis... Surface Area/Volume from the menu. In the resulting dialog, click Apply to compute the Accessible Surface (Gerstein). Chimera will send the coordinates of the structure to the StrucTools server at http://molbio.info.nih.gov/structbio/basic.html and then load the results as an atom attribute named accessibleSurface (by default; a different name could have been specified in the Surface Area/Volume dialog). The new attribute is shown in the Render by Attribute dialog (which can be closed), and the total solvent-accessible surface area is reported in the status line and Reply Log.
* Surface Area/Volume requires internet connectivity. If you are not connected, instead use Define Attribute (Tools... Structure Analysis... Define Attribute) to open the file SurfVolResults1.txt (a local file linked to this tutorial), then continue on from here. The total accessibleSurface from this step is 4952.3 Å2.Open the Attribute Calculator (Tools... Structure Analysis... Attribute Calculator) to calculate totals over sets of atoms. Calculate a new attribute for models with any name you want (name is unimportant as we are only interested in the result of the calculation, not the new attribute). Enter the Formula
sum(atom.accessibleSurface)Check the options to Restrict formula domain to current selection, if any and Show calculation results in Reply Log; uncheck the others. Next, select peptide chain A:
Command: sel :.aClick Apply to compute the sum; open the Reply Log (Tools... Utilities... Reply Log) to see the result. Similarly, select chain B and repeat the calculation. The totals for chain A and B do not add up to the overall total. This is because the total also includes the water molecules. Delete the waters:
Command: delete solventGo back to the Surface Area/Volume dialog and repeat the calculation* (this time clicking OK to also dismiss the dialog).
* Surface Area/Volume requires internet connectivity. If you are not connected, instead use Define Attribute (Tools... Structure Analysis... Define Attribute) to open the file SurfVolResults2.txt (a local file linked to this tutorial), then continue on from here. The total accessibleSurface from this step is 4557.05 Å2.With the Attribute Calculator, again obtain totals for chains A and B (select the chain, Apply the calculation) to verify that they add up to the overall total. Close the Attribute Calculator and Reply Log. It is important to realize that the total for a chain only reflects the contribution of that chain to the surface enclosing both chains A and B. To obtain the area of the surface that completely encloses only one chain, only that chain must be included in the coordinates that are sent to the server. This can be accomplished by using the Chains tab in the Surface Area/Volume dialog, or by deleting the rest of the molecule before initiating the Surface Area/Volume calculation. If the rest of the molecule is deleted, the original structure must be opened again to perform calculations on the whole structure or the other chain.
New attributes can be used in the command line just like built-in attributes. Select atoms with solvent-accessible areas greater than 40 Å2, promote the selection to residues, and then display the selection:
Command: sel @/accessibleSurface>40Finally, display all atoms as spheres and color them by their accessibleSurface values:
Command: sel up
Command: disp sel
Command: ~sel
Command: ~ribbonRangecolor is the command alternative to Render by Attribute for coloring. The result should resemble the figure.
Command: disp
Command: repr sphereCommand: rangecol accessibleSurface 0 blue 5 cyan 20 yellow 40 hot pink
Close the model:
Command: close 0Go on to Part 2 below, OR terminate the Chimera session with the following command:
Command: stop
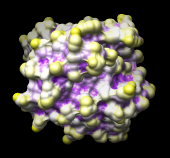
| 121p colored by convexity |
|---|
 |
Begin with Chimera started and the Command Line (and optionally the Side View) opened as described at the beginning of Part 1.
If you have internet connectivity, use a command to fetch the PDB structure 121p:
Command: open 121pIf you do not have internet connectivity, download the file 121p.pdb included with this tutorial and use File... Open to open it.
The structure is H-ras, a small GTP-binding protein, along with a bound GTP analog, a Mg++ ion, and some water. Delete the water and change to a ribbon display of the protein:
Command: delete solventMove and scale the structure as desired throughout the tutorial. Show all residues within 4 angstroms of any ions, use the stick representation of atoms and bonds, color by element, label the residues, and color the labels red:
Command: ~disp
Command: ribbon
Command: ribrepr sharp
Command: display ions z<4(The latter command contains a lowercase letter l, not the number 1.) The active site Mg++ ion is coordinated by serine-17, threonine-35, and phosphonate oxygens in the GTP analog, which is named GTO.
Command: repr stick
Command: col byelement
Command: rlabel ions z<4
Command: color red,l
In HOMSTRAD, this protein is classified in the GTP-binding protein family. Download the alignment file homstrad-gtp.pir (originally from HOMSTRAD, now included with this tutorial) and open it with File... Open. The file type is Aligned NBRF/PIR. The alignment will be shown with Multalign Viewer. The structure will automatically associate with the sequence named 5p21, as indicated by the white rectangle under this sequence name.
When a structure is associated with a sequence alignment open in Multalign Viewer, its residues are assigned a mavPercentConserved attribute. From the Multalign Viewer menu, choose Structure... Render by Conservation. This opens the same Render by Attribute tool used in Part 1, except that now it shows the attribute of residues named mavPercentConserved. Render the values with Colors; use any coloring scheme you like to show this attribute, then close the Render by Attribute dialog. It is evident that many of the most conserved residues are in or near the binding site. Undisplay the labels and select residues within 6 angstroms of the ligand, GTO:
Command: ~rlabelThe selection is shown in the Multalign Viewer sequence window as green boxes around the corresponding residues. Like other attributes, mavPercentConserved can be used as a command-line criterion:
Command: select ligand z<6
Command: select ligand z<6 & :/mavPercentConserved>80This selects a smaller set of residues than before, only those both within 6 angstroms of the ligand and associated with positions with >80% conservation in the sequence alignment. Clear the selection (Select... Clear Selection is one way) and Quit from Multalign Viewer.
Finally, we will use Surface Area/Volume to obtain molecular and solvent-accessible surface areas for the protein atoms and then use the Attribute Calculator to create a new attribute from these areas. To get surface areas for the protein only (not enclosing any solvent or other bound molecules) it is necessary to first delete the other parts of the structure:
Command: delete ions | ligand(solvent was deleted earlier). Choose Tools... Surface/Binding Analysis... Surface Area/Volume from the menu.* Compute the Surface Area (MSMS); click OK to perform the calculation and dismiss the dialog. Chimera will send the coordinates of the structure to the StrucTools server at http://molbio.info.nih.gov/structbio/basic.html and then load the results as atom attributes named msmsArea_MS and msmsArea_SAS (by default; different names could have been specified). The new attributes are listed in the Render by Attribute dialog. A warning may appear stating that not all atoms were present in the output from the server. Close the warning dialog; this is a fairly common occurrence that usually does not interfere with further calculations.
* Surface Area/Volume requires internet connectivity. If you are not connected, instead use Define Attribute (Tools... Structure Analysis... Define Attribute) to open the file SurfVolResults3.txt (a local file linked to this tutorial), then continue on from here.Open the Attribute Calculator (Tools... Structure Analysis... Attribute Calculator). Calculate another new attribute named convexity for atoms using the Formula
atom.msmsArea_SAS/atom.msmsArea_MSCheck the options to Open Render/Select by Attribute and Save calculation results to file; uncheck the others. Click OK to perform the calculation and assignment. A warning message will appear because some atoms have a molecular surface area (msmsArea_MS) of zero, resulting in a divide-by-zero error. However, just close the warning dialog; the attribute convexity has been assigned correctly for the atoms with nonzero areas. Name the output file convexity.txt. In a later Chimera session with the same structure, convexity.txt could be opened with Define Attribute to assign atomic convexity values directly (without any recomputation). However, in this case we will render the values with color. Undisplay the ribbon and surface the protein:
Command: ~ribbonIn the Render by Attribute dialog, make sure that the histogram is showing the new attribute of atoms named convexity. Render the values with Colors. Change the lowest-value (leftmost) threshold to purple and the highest-value threshold to yellow (these names can be entered directly in the Color name field of the Color Editor). Use white for the middle threshold and set its Value to 1 (values > 1 represent convex areas, while values < 1 represent concave areas). Click Apply.
Command: surf
Small areas of other, previously used colors may peek through; this is because the atomic radii in Chimera differ slightly from the radii used by the StrucTools server. The colors that peek through are for atoms that are not exposed at all according to the StrucTools calculations. Set these areas to purple too, using the color well marked No-value color in the Render by Attribute dialog. Click Apply again; the result should resemble the figure.
If you wish, try applying different color mappings (changing colors, threshold positions, and/or number of thresholds). When finished, end the Chimera session:
Command: stop