 JPEG version (42KB),
TIFF version (457KB)
 JPEG version (42KB),
TIFF version (457KB)
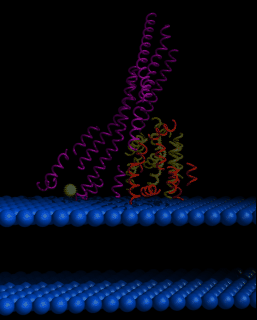
This image shows a model of Colicin Ia as it may associate with a bilayer membrane prior to insertion into the bilayer. The blue surface represents the phospholipid head groups at the surface of the inner bacterial membrane. The green sphere indicates a site know to be closely associated to the membrane via experimentation. The 10 alpha-helix sub-domain of the Insertion Domain is shown in yellow and the 8 alpha-helix sub-domain of the Insertion Domain in orange. The Attachment Domain as well as the Bridging Domain are shown in red.
This file, bilayer.pdb, was opened twice in MidasPlus, and one of the layers was moved 40 angstroms away from the first layer with the "move" command.
	command:  open 0 bilayer.pdb
	command:  open 1 bilayer.pdb
	command:  move z 40 1
Within MidasPlus, the radius of the atom type ``O'' (oxygen), of which the bilayer happened to be constructed, was made to be the radius of a phospholipid head. If working with oxygen atoms in the rest of a session, the ``O'' could have been any atom type, for example, we could have called the bilayer atoms ``R''.
To change the radius of the atoms, the MidasPlus command ``vdwopt define'' is used:
command: vdwopt define O 4.5Finally, neon was used to render the image. Using a neon.dat file, the tube type was set to 1, or smooth, and the atom size was set to 1.0.
The following is what the neon.dat file could look like. A neon.dat file is included in the directory /usr/local/midas/demos/sample_files.
1		|Tubetype           |0=all atoms, 1=smooth, 2=bent, 3=straight|
3		|Sphere density     |1=rough, 5=high resolution               |
1		|Dash    flag       |0=no dashes,  1=draw dashes              |
1		|Object  flag       |0=no objects, 1=draw objects             |
0		|CPK     flag       |0=normal Render output, 1=CPK output     |
0.18		|Stick   thickness  |Angstroms                                |
0.50		|Tube    thickness  |Angstroms                                |
0.15		|Dash    thickness  |Angstroms                                |
0.20		|Object  thickness  |Angstroms                                |
0.04		|Density thickness  |Angstroms                                |
0		|Atom rendering     |0=stick, 1=ball & stick                  |
1.00		|Atom size          |Fraction of vdw radius (ball& stick mode)|
1 0.50		|Depthcue,Percent   |0=n, 1=y; percent aft intensity          |
0 0.0 0.0 	|B-factor,Range     |0=n, 1=shade to color, 2=rainbow; min-max|
1.0 1.0 1.0	|B-factor color     |RGB (red, green, blue)                   |
4		|Number of dashes   |Number drawn between each pair of atoms  |
1.0 1.0 1.0	|Dash color         |RGB (red, green, blue)                   |
0.30		|Dash offset        |Dist. from atom to first dash, Angstroms |
0.00		|Dash/space ratio   |0.0=dots, 0.4=dashes, 1.0=solid line     |
4.00		|CA conect distance |Angstroms                                |