Chromocenter polarization
Tom Goddard
June 3, 2015
Images and angles for chromocenter polarization in cycle 3 (4 cell stage) Drosophila embryo
for 4 data sets acquired by Tom Kornberg on May 15, 2015.
| 
| 
| 
|
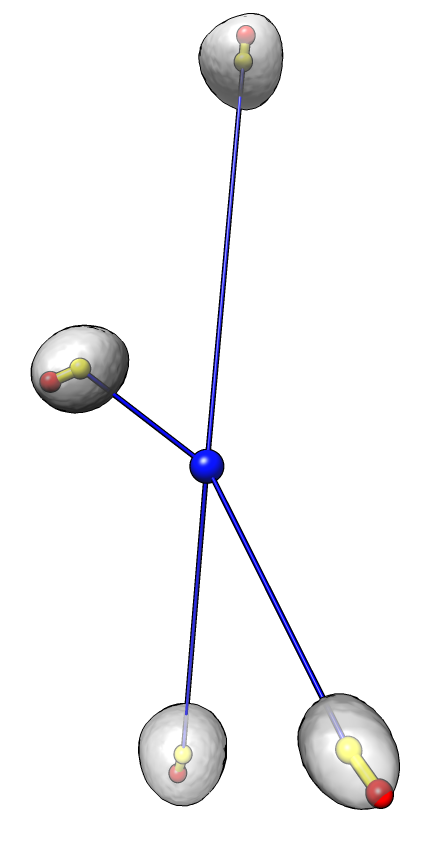
Dataset 1
Angles: 31 62 13 14
Average angle: 30
P-value 5e-4 (1 in 2000)
|
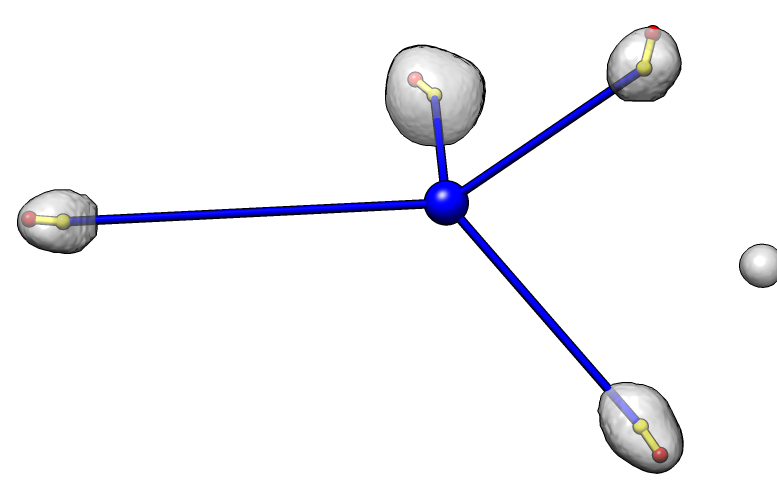
Dataset 2
Angles: 48 40 11 14
Average angle: 28
P-value: 2.8e-4 (1 in 3600)
|
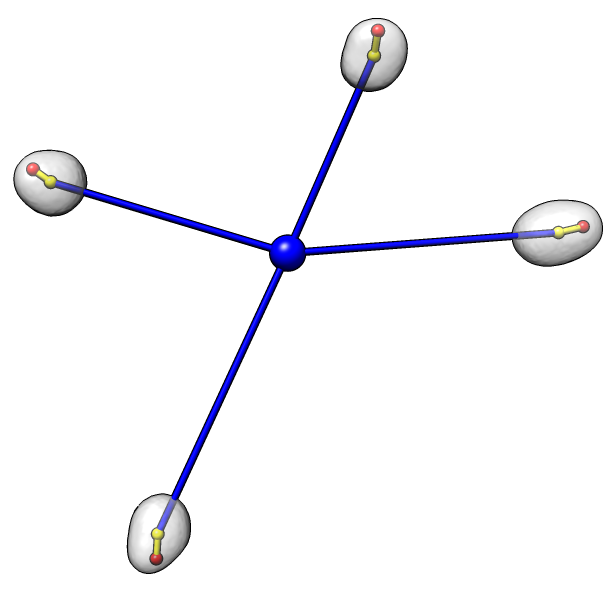
Dataset 3
Angles: 13 27 20 23
Average angle: 21
P-value: 3e-5 (1 in 33000)
|
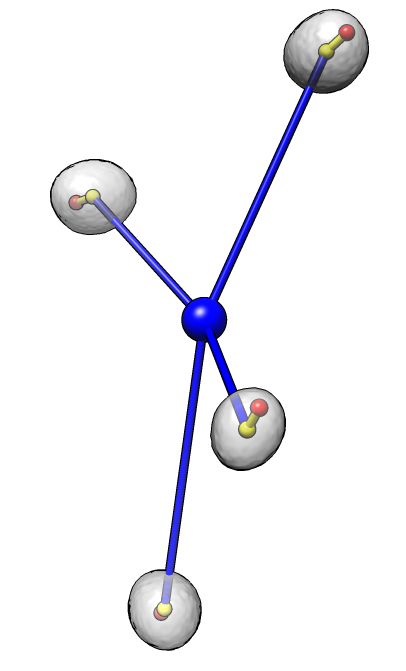
Dataset 4
Angles: 41 49 59 76
Average angle: 56
P-value: 4e-2 (1 in 25)
|
Each nucleus is shown as a transparent gray surface with nucleus center marked with a yellow sphere
and chromocenter marked with a red sphere. The common center of the 4 nuclei is marked with a blue sphere.
An angle is measured for each nucleus to indicate the degree to which the chromocenter is positioned far
from the common center. The measured angle is between the line defined by the common center and nucleus center
(blue line) and the line defined by the nucleus center and the chromocenter (yellow line). An angle of 0
indicates the chromocenter is directly away from the common center, while an angle of 180 degrees indicates
the chromocenter is positioned directly towards the chromocenter. The average angle of the 4 cells
for each data set is reported. A probability value for obtaining an average value less than that observed
given random chromocenter positions is given.
Additional Details
1) Chromocenters were hand marked by Tom Kornberg, painted as a disc in a 2-d xy plane.
The red markers were placed at the center of the painted disk.
2) 3d optical microscopy was with DAPI staining and a chromocenter specific antibody stain.
I believe the data comes from John Sedat's lab.
The microscope data grid spacing was reported as 0.17, 0.17, 0.896 along x,y,z but this
makes nuclei appear very elongated in z. To make the nuclei appear round the above analysis used
a z grid spacing of 0.448 (half the reported value). This should be investigated.
3) Smoothed nuclear envelope surfaces used DAPI signal, binned 4 by 4 by 1 grid points (in x, y, and z)
followed by Gaussian smoothing with a Gaussian standard deviation of 2 microns.
Nucleus surface was drawn at a density level determined by eye.
4) Nucleus centroid marker (yellow) was placed at the area-weighted center of the nucleus surface.
5) The common center of the 4 nuclei (blue sphere) is the average position of the
four nucleus centers (yellow spheres), equally weighted.
6) All angles are in degrees.
7) The four images above are not to the same scale. The images are aligned with microscope data x axis
horizontal, y axis vertical, and z axis perpendicular to the image. The images use perspective projection
so objects further back will appear smaller.