Tom Goddard
March 4, 2015
We are developing software to analyze how neutrophils, the most common type of white blood cell, responsible for innate immunity, migrate to sites of infection. Dyche Mullins' lab at UCSF has acquired microscopy data imaging the cells in motion, capturing a full 3-dimensional density map once per second for periods of about 3 minutes. The dota show the cells crawling through collagen filaments for a distance several times their diameter. The combination of high speed and high resolution was achieved using Eric Betzig's Bessel-beam microscope [1] at Janelia Farm. Betzig won the Nobel prize in chemistry this year for his development of advanced microscope technologies. The imaging data sets are large, typically tens of gigabytes and ten terabytes of data has been collected on dozens of cells with different fluorescent stains and under different experimental conditions. Dyche Mullins is particularly interested in the dynamic creation of actin filament networks within the cells which support cell protrusions and enable locomotion [2].
|
|
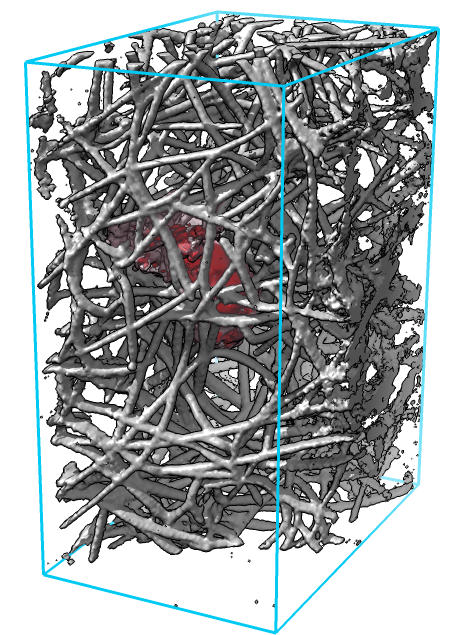
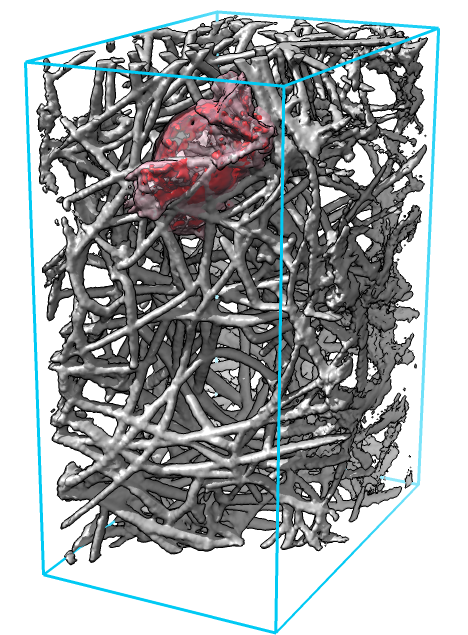
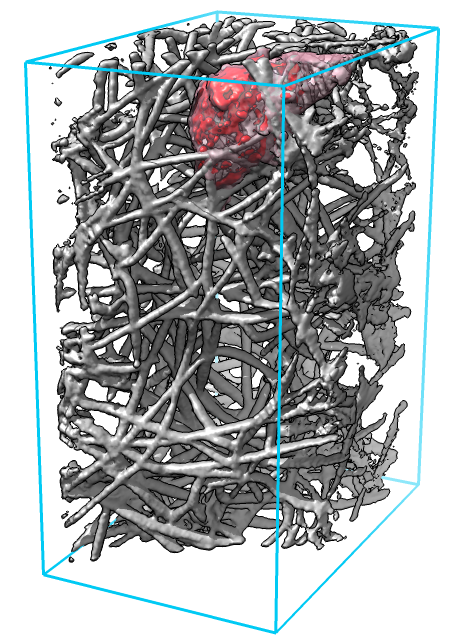
| Figure 1: Cell (red) moving through a dense network of collagen filaments (gray) seen at 3 time points about 1 minute apart. |
Locating features of interest in the 4-dimensional image data (3 space dimensions plus time) is done by a researcher carefully viewing the data (figure 1). Movies recorded from one view point capture cell protrusions only from one angle, and collagen filaments often obstruct the view. We tried movies from multiple view points and found it difficult to observe all sides of the cell, and recorded movies make it hard to follow up with more detailed views of interesting cell-collagen interactions.
To aid understanding the cell motion data we have developed a real-time viewer where the data can be rotated and zoomed and played to any time interactively. To examine many data sets the process needs to be as efficient possible, a dozen data sets consisting of 1 terabyte of data takes 3 hours to merely copy from one hard-drive to another. By compressing the data, and allowing sampling at different resolutions we reduce it so one data set fits in memory on a typical laptop computer so no special hardware is needed. The compression is loses information that is primarily low level noise.
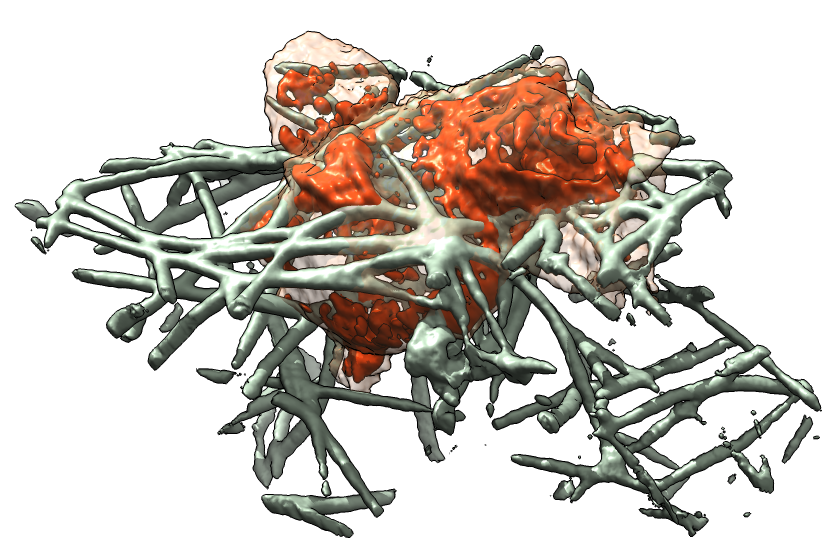
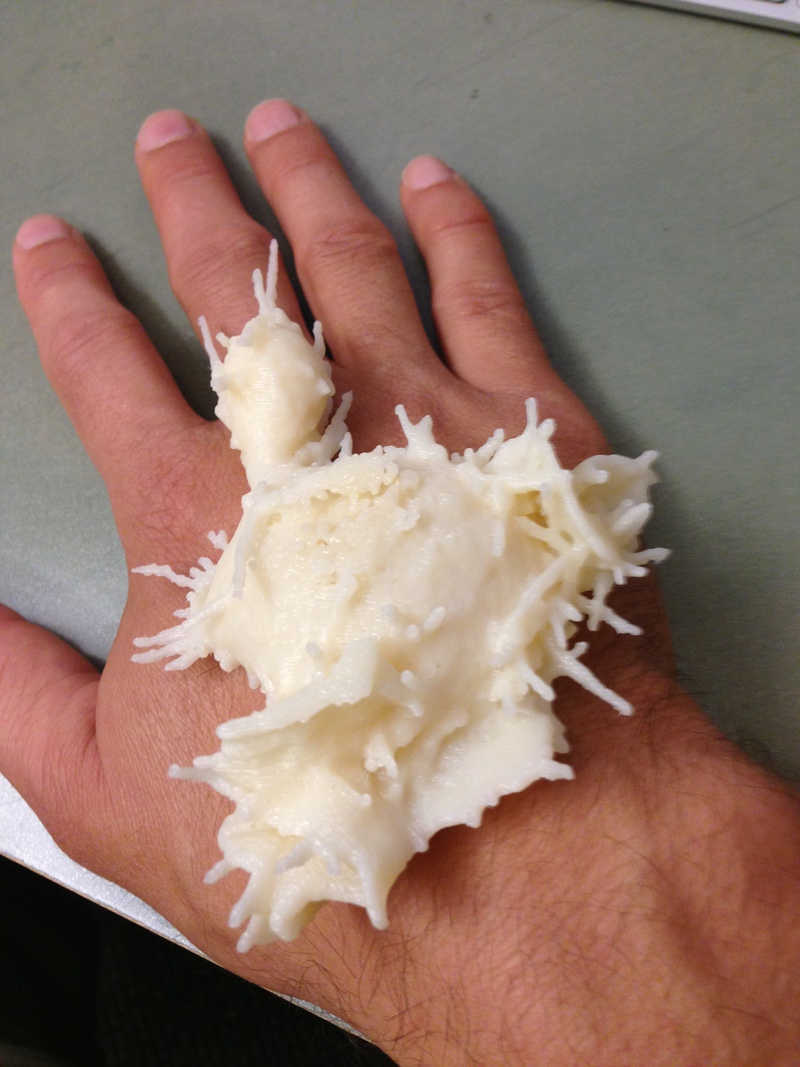
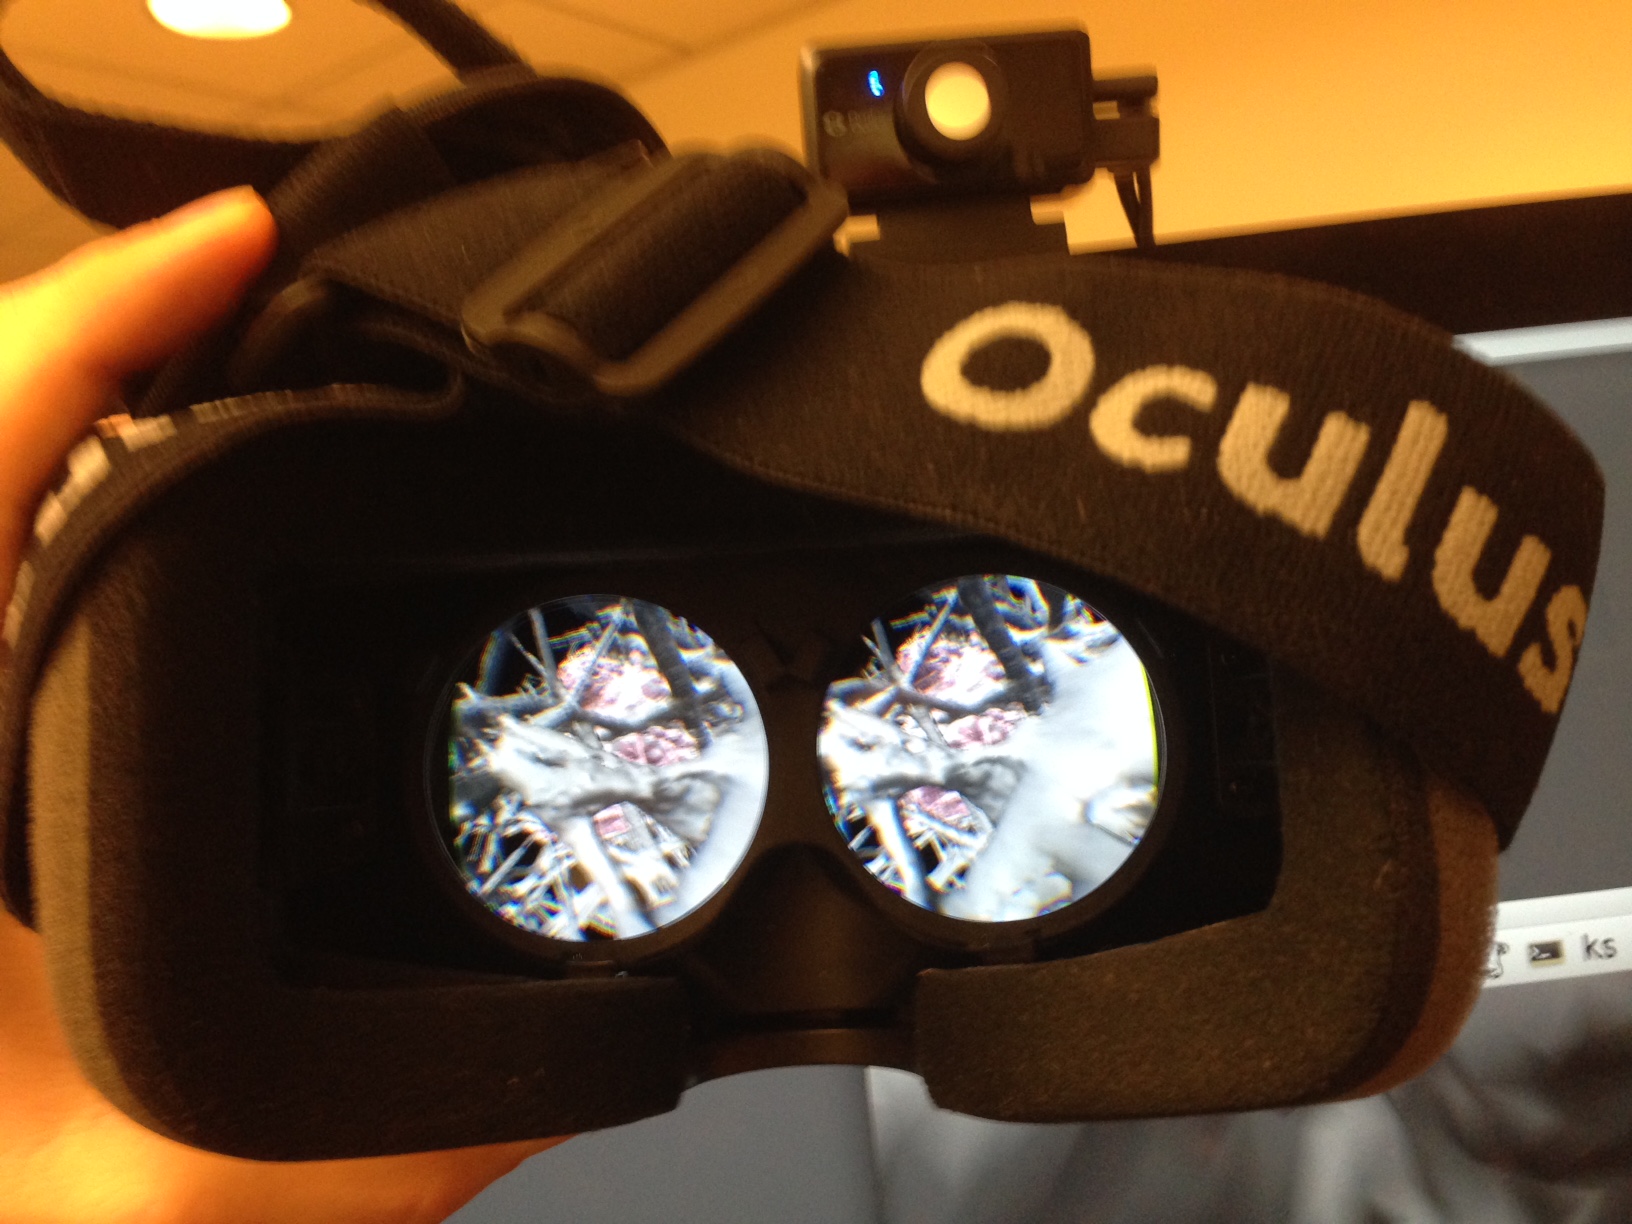
To allow an unobstructed view of the cell feeling the collagen filaments we are able to mask and show only those filaments that are close to the cell's path of movement (figure 2). We have made 3-d printed plastic models of the neutrophil cells which are useful during discussions between the collaborating researchers to physically point out features of the data. Also we have viewed the confined spaces that the cell moves through from a perspective inside the network of filaments with Oculus Rift goggles which allow a 3d and 360 degree perception of the cell environment.
| 
| 
|
| Figure 2: Alternative views of neutrophil cells. Left: Collagen filaments (green) shown only near the path of the moving cell (orange). Middle: Printed plastic model. Right: Immersive 360 degree display with Oculus Rift goggles. | ||
|
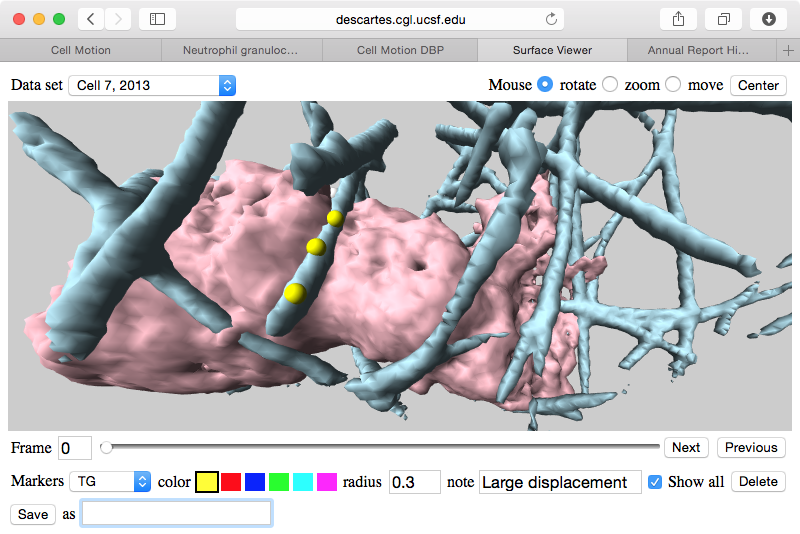
| Figure 3: Web browser application to mark and data sets allows researchers to easily share the locations of interesting features in the data. |
We have found it challenging to communicate features of interest found in the cell microscopy data by the 5 researchers from 3 labs at UC San Francisco engaged in mining the data. In order to annotate the features we developed a web browser application that allows rotation, zooming, playing through time, and placing markers on cell protrusions or collagen using mouse clicks. Text can be added to markers to describe the observed feature. The large data sets reside on a web server and only compressed surface depictions are sent to the web browser. Also the markers placed by each researcher reside on the web server so they can be immediately viewed by collaborators.
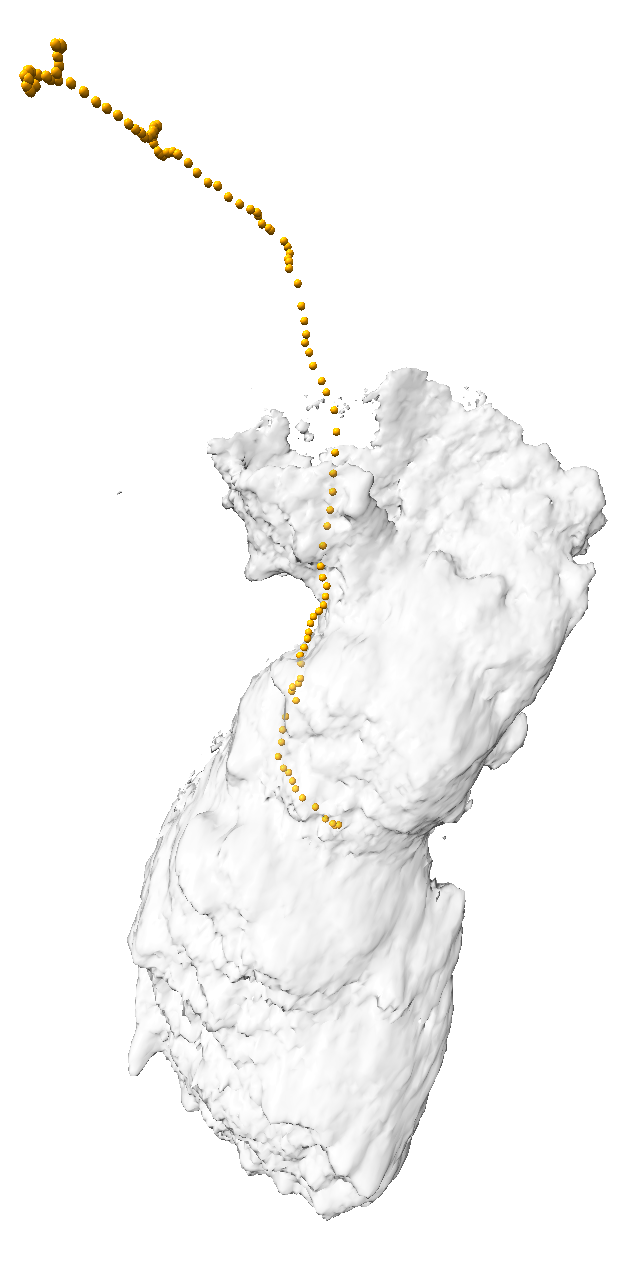
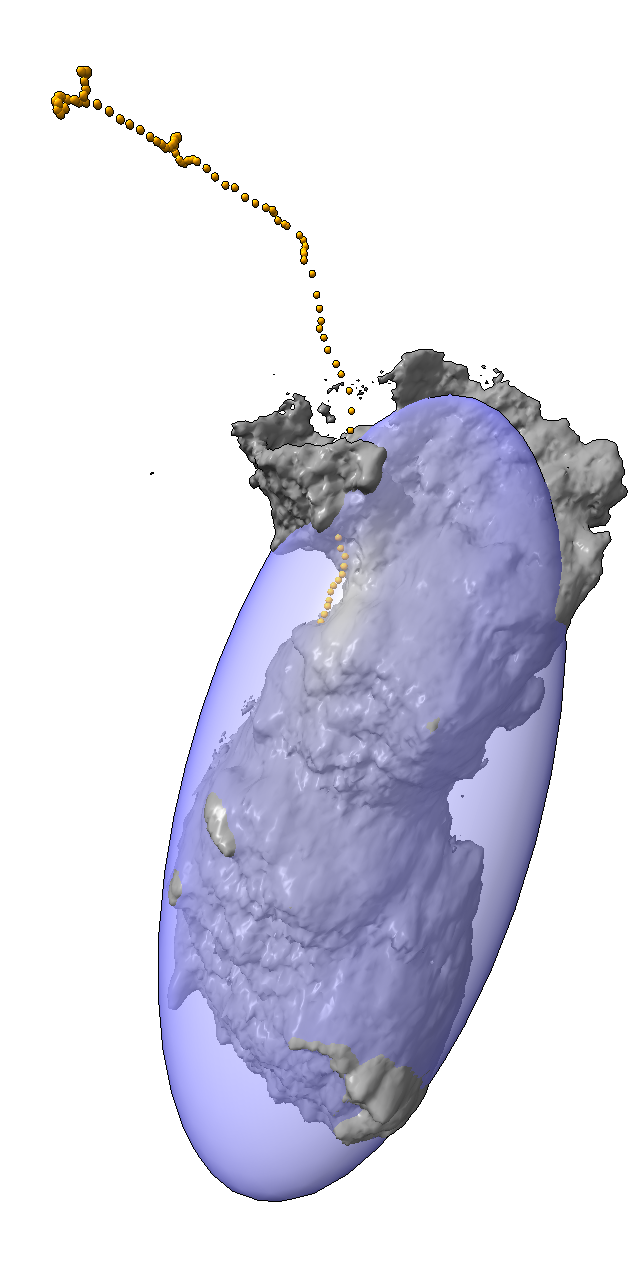
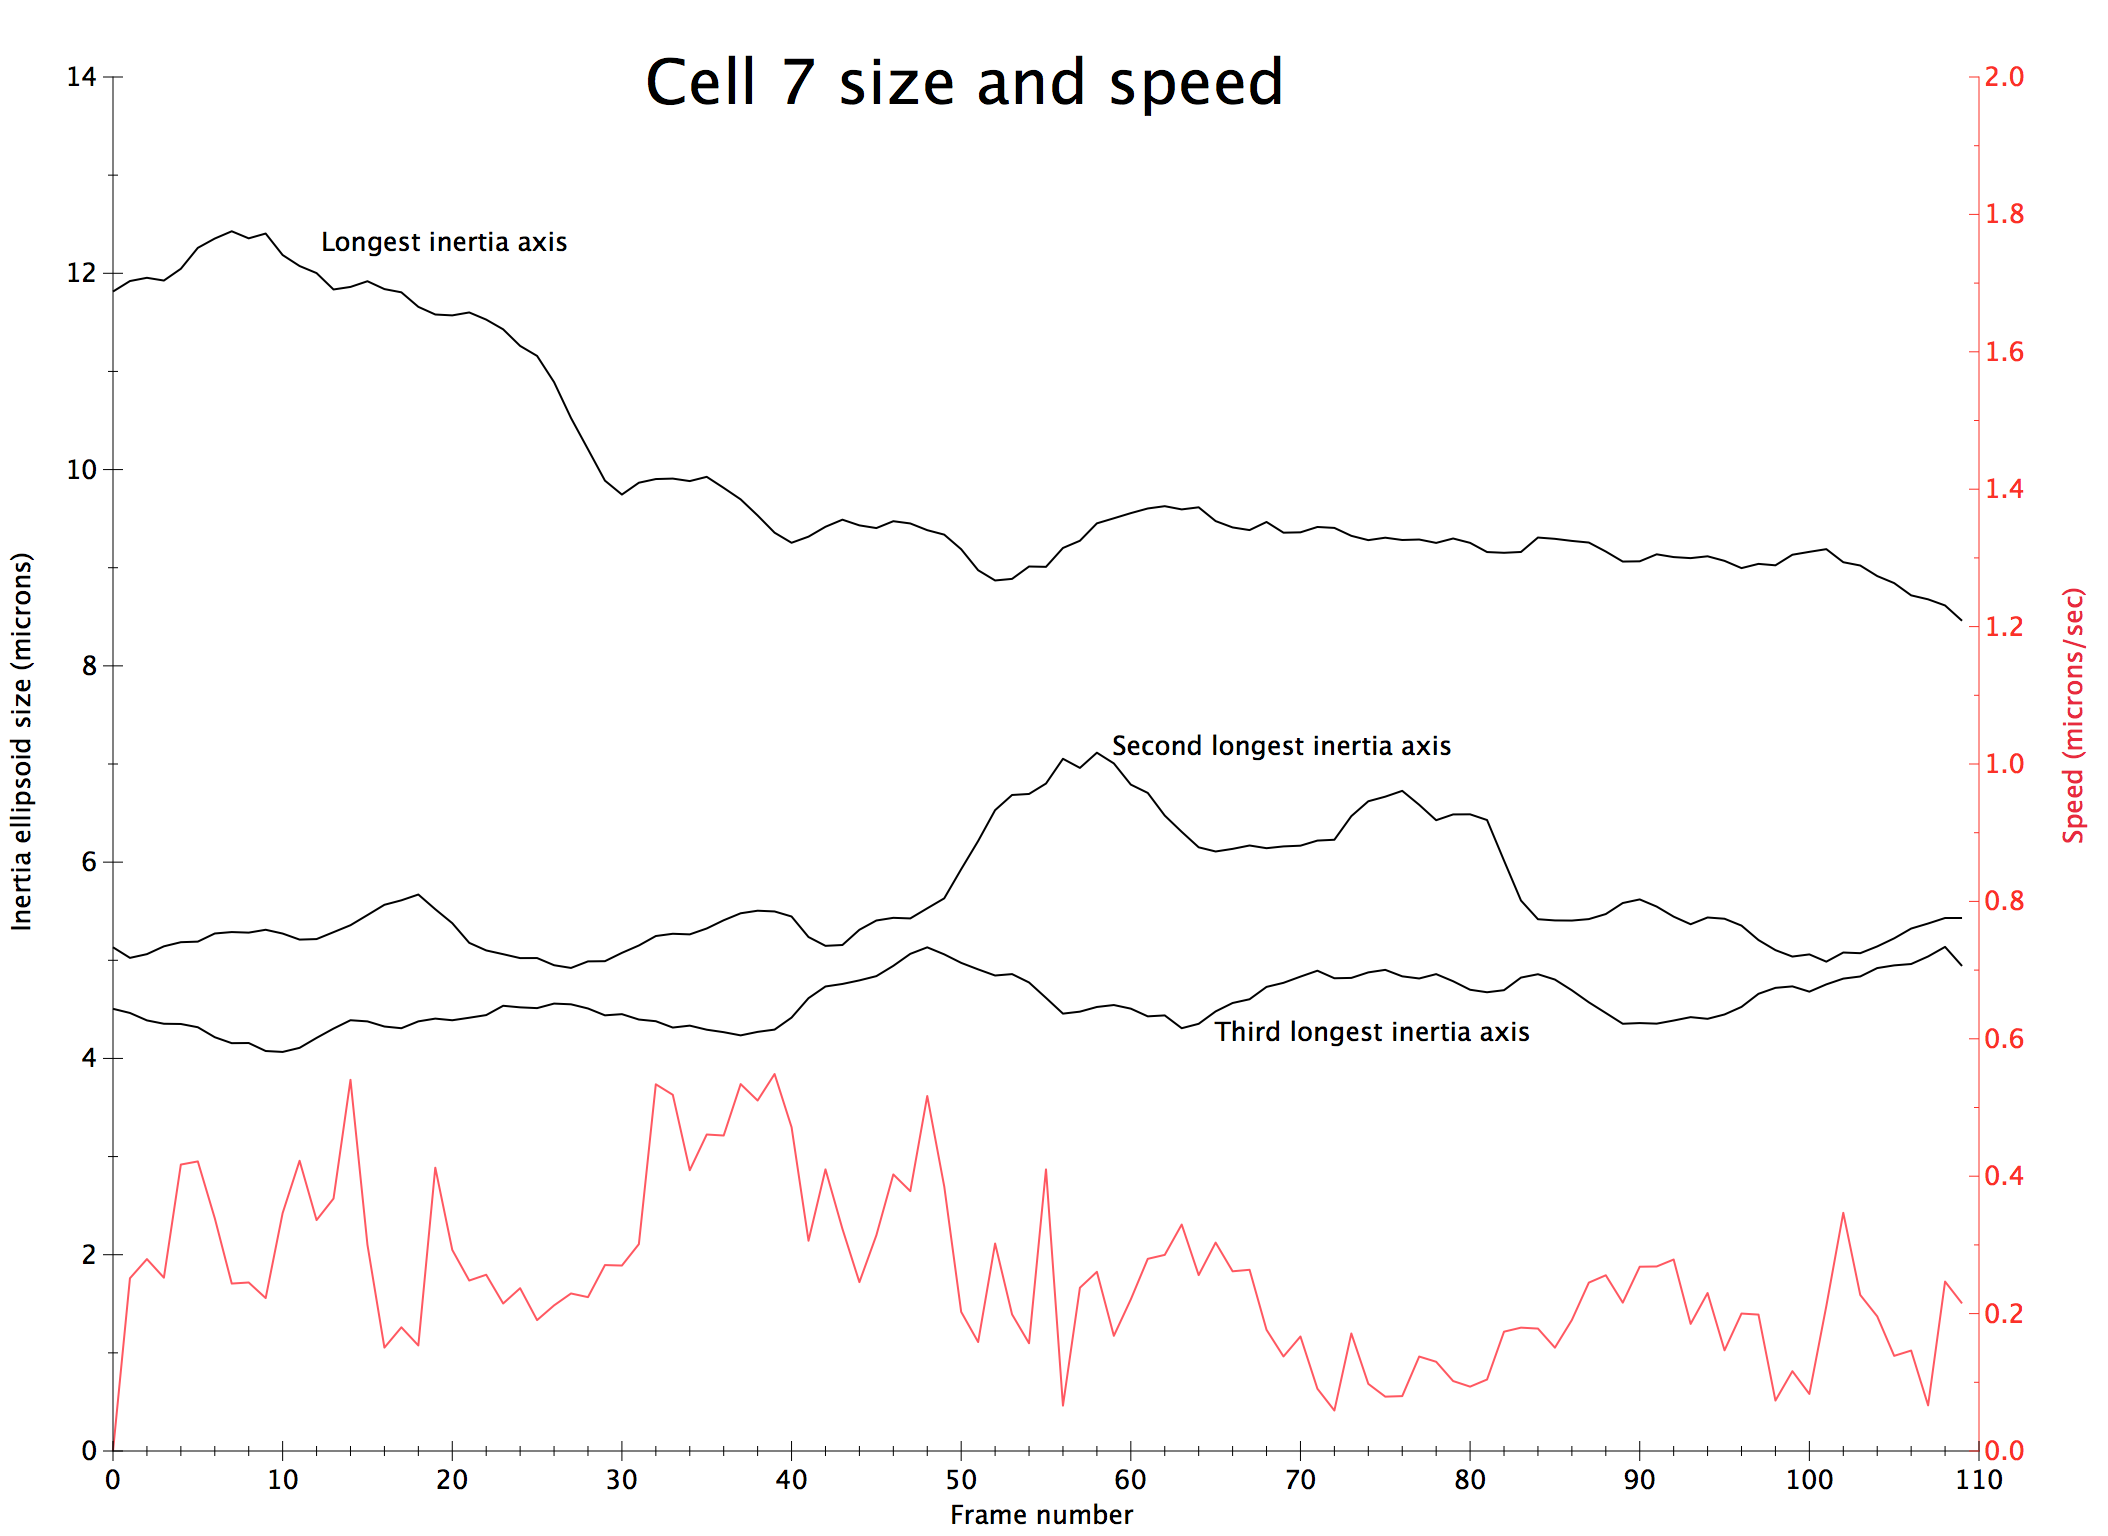
We are developing the software to quantify the observed dynamic behavior of cells (figure 4). We measure simple properties such as the motion of the centroid of the cell to find its speed. To measure shape we compute the cells principle axes of inertia, which gives an approximation the cell as an ellipsoid. These derived properties help determine if the cell changes its degree of elongation during motion, extending forward and then pulling its trailing end along inch-worm fashion or if the motion is a smooth glide forward. We are looking at whether the cell stops at points where it extends protrusions in 3 different directions in order to decide whether to change its direction of motion.
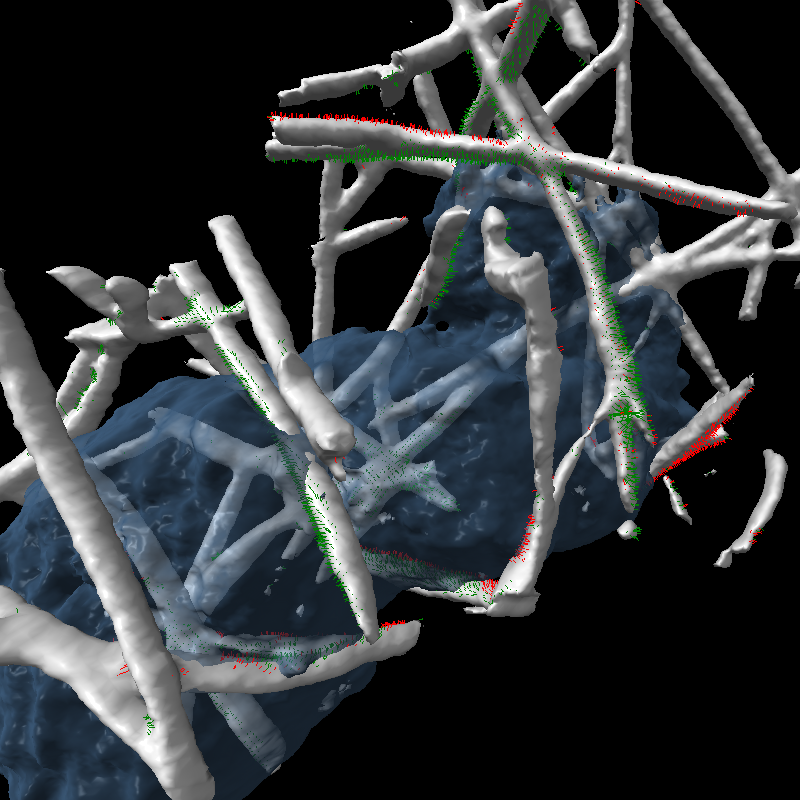
Another problem we have begun to solve using new software tools is quantifying the force exerted by the cell on the collagen filaments by measuring the displacement of those filaments. While it is clearly seen that the cell pushes the filaments to the side, it is not apparent whether it sticks to and pulls filaments.
| 
| 
| 
|
| Figure 4: Measurements of cell motion. Left: Centroids (orange), initial cell position (gray), and approximating ellipsoid (blue). Middle: Plot of cell size along 3 principle axes and speed (red). Right: Prickles on collagen show the filament displacement to the next time point (green) and motion from the previous time point (red). | |||
[1] Chen B-C, Legant WR, Wang K, et al. Lattice Light Sheet Microscopy: Imaging Molecules to Embryos at High Spatiotemporal Resolution. Science (New York, NY). 2014;346(6208):1257998. doi:10.1126/science.1257998.
[2] Ingerman E, Hsiao JY, Mullins RD. Arp2/3 complex ATP hydrolysis promotes lamellipodial actin network disassembly but is dispensable for assembly. The Journal of Cell Biology. 2013;200(5):619-633. doi:10.1083/jcb.201211069.