Tom Goddard
March 14, 2014
The process of biology research is undergoing a geologic shift from data poor to data rich, from human intensive analysis to computer intensive analysis. Never before has so much rich biological data gone unanalyzed, a situation caused by rapid advances in experimental equipment and technique outpacing development of tools for data analysis. Ideas for how to analyze data are abundant, proven to work, and already implemented, but current analysis software developed 5 or more years ago simply does not scale to today's bigger data sets. For example, methods to align a few conformations of a disease-related protein are readily available, each new conformation involves mouse clicks and typing by the researcher to achieve the result. But to apply this to 200 variants of an HIV protein structure is so much clicking and typing that the analysis will not be done unless it can be automated. Young researchers have the computer skills to write the software script to automate this analysis step, but moderately more complex analysis on large data sets is out of reach of most labs. Many of the stunning results in biology today are made by the biggest labs who have dedicated computer programming staff to make big data analysis tractable.
Our RBVI resource center's focus is development of visualization and analysis software, and we have been implementing the next generation of our UCSF Chimera package to allow average research labs to make breakthroughs using the big data coming from current instruments. Here are several examples of big data problems and solutions we've worked on this year.
|
|
|
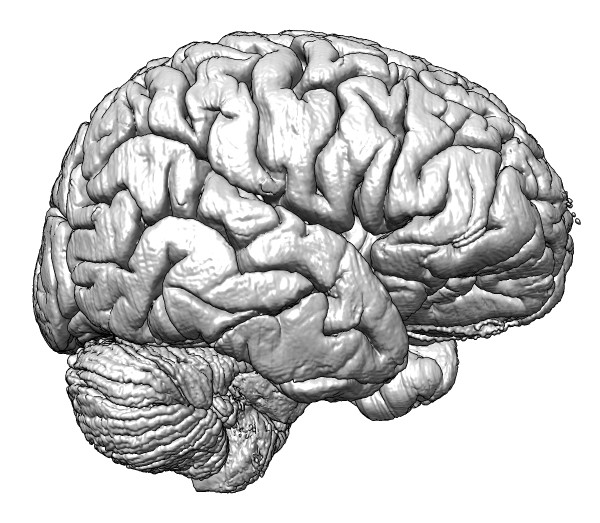
| Figure 1: Optical imaging of the human brain at 10 microns resolution, a 1 terabyte data set. | |
Neurobiology researchers believe electron microscopy techniques are close to being able to image an entire fly millimeter size brain [1] which would resolve the entire wiring of the brain. A longer term goal is to image the human brain at this high resolution that will discern every neuronal connection. This is still probably a decade away, but in 2013 the highest resolution optical microscopy of the whole human brain was published [2] in a collaborative effort called the Big Brain Project. They acquired 7400 slices at 10 micron pixel resolution, producing a 3-dimensional data set 1 terabyte in size. While this data set is approximately a million times smaller (100 times too coarse in each dimension) than what will be required to resolve neuronal connections, it is a challenge to handle with current visualization software.
We show this imaging data set in a planetarium dome video touring human brain structures from the full brain to neuron packing, electron microscopy of parts of neurons and synapses and down to the molecular scale of ion channels that control the flow of electrical signals (https://www.youtube.com/watch?v=RE2XMzInX_o). We ran into difficulties visualizing this 3-d model with its large range of spatial scales from 10 centimeters down to Angstroms, covering 9 powers of ten. Floating-point numbers are often represented in computer software with a precision of 7 decimal digits, but handling this brain model required double precision values to avoid molecules jittering at random due to round-off errors as the virtual camera moves through the data. While the Chimera visualization software uses double precision throughout, it turned out the underlying OpenGL graphics library only used single-precision, making the software improvements difficult to implement.
While 1 terabyte of data will fit on a $100 portable disk drive, it presents some analysis difficulties. To just read this data one time from disk takes approximately 3 hours, limited by the disk speed. To make interactive work practical we saved a version with compression (about half of the imaged box is empty space), and including multiple resolution copies all in one HDF5 format file. The HDF5 file format is popular in other scientific disciplines but is only recently starting to be used for large biology data.
The software improvements we made to handle this data are available in the UCSF Chimera software package. We were not able to offer solutions to all the problems we encountered. Simply getting the data over the internet proved challenging. Reflecting the immature methods of handling large data sets, this data was available only by browsing single images (7400) which could only be downloaded one at a time. Writing a script to fetch the data was made difficult by the required password authentication handled by web browser cookies. Such obstacles prevent analysis of ostensibly public data.
|
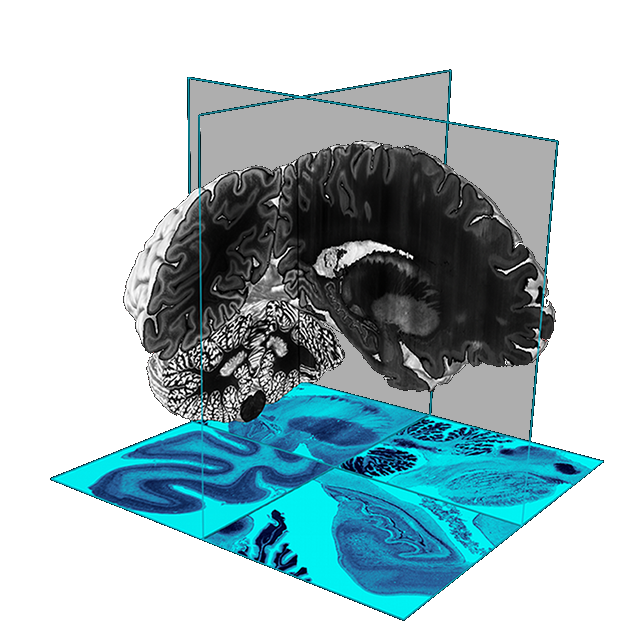
| Figure 2: Macrophage-like hl60 cell moving through a network of collagen filaments with only collagen near the path taken by the cell shown. |
Immune system macrophages move through tissues to sites of bacterial or viral infections and engulf infected cells, locating these sites by chemotaxis. Little is known about the mechanisms used by these cells to pass through tissues. The cells extend out spikes (filopodia) and flipper-like sheets (lamellipodia) as they move and these protrusions are generated by dynamically assembled large actin networks within the cell. We are working with Dyche Mullins at UCSF, an expert on cell motility and actin networks, and Eric Betzig of Janelia Farm research campus who has developed a high speed 3-d optical microscope for imaging live samples. This Bessel-beam microscope can acquire a full 3-dimensional map consisting of a few hundred z slices each second in multiple wavelengths. Mullins' lab has imaged individual hl60 cells which are related to macrophages for periods of 3 minutes moving through a collagen network, the cell actin and the collagen being labeled with different fluorophores.
The data sets are about 50 Gbytes a piece and about 10 sets have been acquired with different labeling. We use thresholding, data compression, and multiple resolution copies within a single HDF5 file to allow interactively stepping through the data. By extending software capabilities designed to show zones of density maps near a molecular structure, we have been able to show just the part of the extracellular collagen network that the moving cell touches during its 3 minute journey. This is essential to allow a view through the crisscrossing collagen to see how the cell interacts with the obstacles it encounters. Capabilities were added to our Chimera analysis software to make a mask of the volume swept out by the moving cell, and then extend that by a fixed distance and use it to mask the collage at all time points.
|
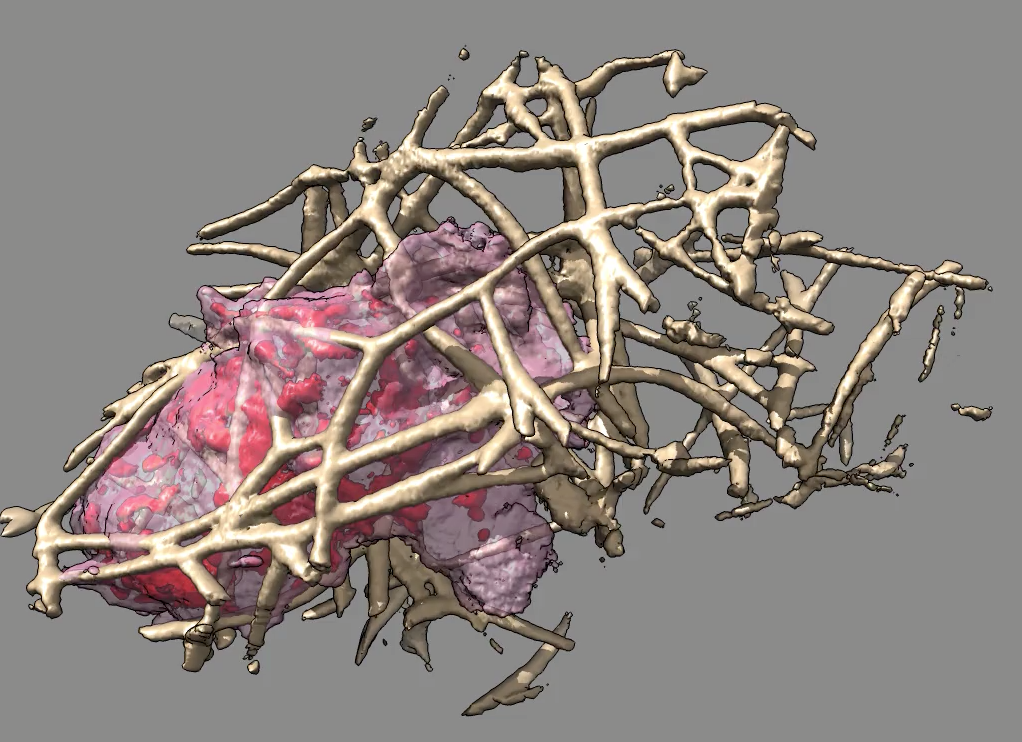
| Figure 3: HIV virus capsid encloses the viral RNA genome. Model consists of 2.4 million atoms derived from electron tomography and molecular dynamics. |
More than a thousand atomic resolution molecular structures of proteins and RNA making up the HIV virus have been determined. Graham Johnson at UCSF and the HIV Interaction and Viral Evolution Center (HIVE, http://hive.scripps.edu) headed by Art Olson at Scripps are combining these models into plausible full virus particle models in different states (immature, mature, bound inhibitors, ...) to provide insights into the molecular interactions HIV relies on to replicate itself. A single virus particle a little larger than 100 nanometers in diameter contains many thousands of copies of a small number (tens) of proteins. These statistical representative models will require new visualization software to handle the large size while allowing studies of atomic details.
One component of the new models is a new HIV virus capsid model derived from electron tomography and molecular dynamics published [3] in 2013, and available in the Protein Databank as either 25 PDB format files, or a single mmCIF format file (3j3q). The large mmCIF file containing 2.4 million atoms takes a half hour to load in our current generation visualization software and takes more than 30 Gbytes of memory. A primary aim of our next generation Chimera visualization software which has been under development the past year is to handle these large models at high speed, and currently is able to load and display this structure in about 3 seconds (close to 1 million atoms per second) using about 0.5 Gbytes of memory. The Protein Data Bank has in the past split molecular structures into multiple files each of which is no more than 100,000 atoms but in the coming year has announced they will combine split structures into single mmCIF entries.
Handling many atoms efficiently is one aspect of visualizing large models. Multiple resolution representations are needed to show structures at the desired level of detail. To assist making the full HIV virus model we processed the HIV capsid atomic model, replacing each copy of the 1356 proteins with a single representative copy which can be displayed as a blob-like surface. For still lower resolution we made a surface representing the whole cone-shaped capsid defined by points at the center of the 6-member and 5-member rings (228 in total). Lower levels of detail can be displayed when other molecules are the focus of interest.
|
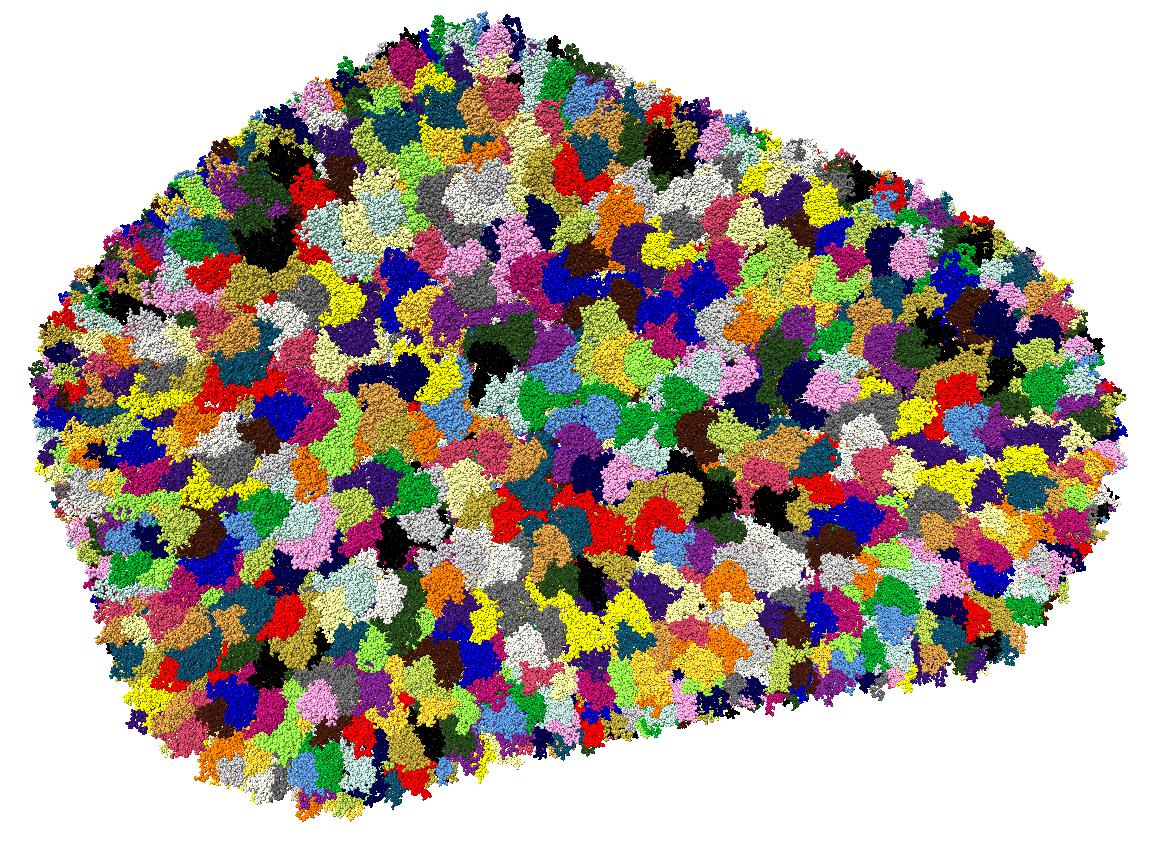
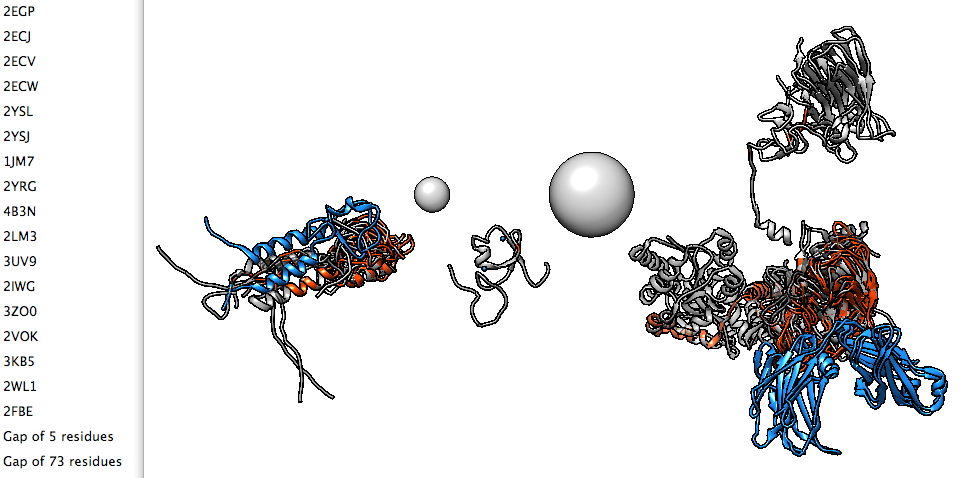
| Figure 4: Seventeen domain structures of TRIM5alpha, an HIV restriction factor which protects against AIDS in some primates. |
The Protein Data Bank has about 100,000 structures thanks to advances in high throughput x-ray crystallography. But many of these structures are just single domains of larger proteins that are difficult to crystallize. Sam Hertig, a postdoc in the resource center, is developing software to find all of the available domain structures for a protein of interest and join them to create models. This software integrates standard tools such as BLAST sequence searches to find the domains and homology model building to assemble them into the full protein. Two test cases are fibronectin which has approximately 30 domains and 70 available structures, and the HIV GAG polyprotein with 4 domains and about 1000 available structures. Much of the complexity arises in figuring out the differences among overlapping available structures to make a sensible choice of templates when building the full protein model. The first steps of the process, finding all available structures for a target sequence and presenting them to the user, has been implemented in the Chimera visualization package.
|
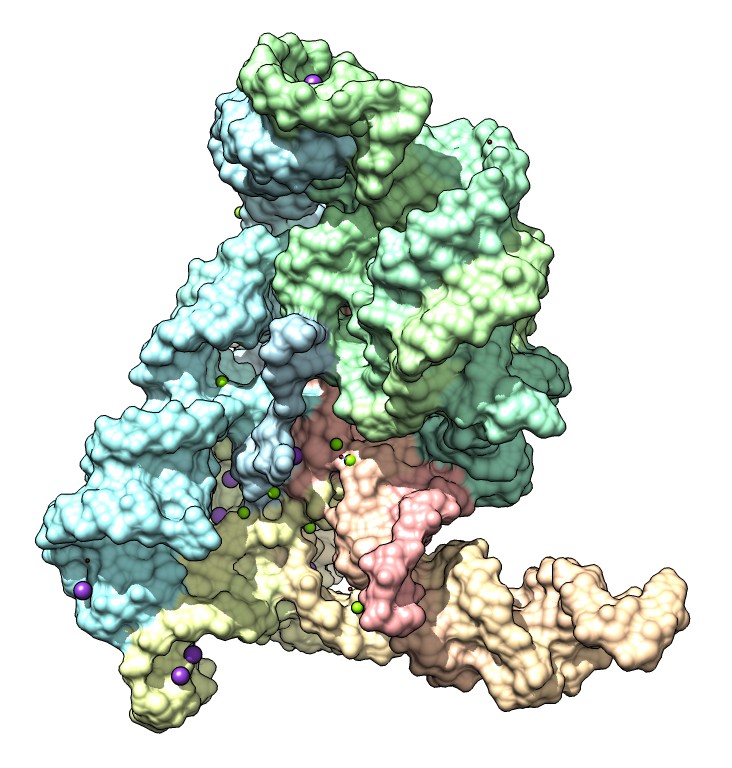
| Figure 5: Solvent excluded surface of a group II intron, a self-splicing RNA machine, with magnesium and potassium ions. Two magnesium ions organized by two potassium ions perform the enzymatic cleavage and joining to excise itself from an mRNA transcript. Calculation of molecular surfaces often fails for such large structures. |
Molecular surfaces are frequently used to represent molecules and colored to show molecular properties. Binding sites for drugs or natural ligands are easily seen in this representation. The most common surface, called a solvent excluded surface (SES), is defined as the points reached by rolling a probe sphere (representing a water molecule) over a protein. This can be calculated analytically, but available software is very complex. The code we use is about 20,000 lines in the C language and suffers from numerical instabilities that cause the calculation to fail for large structures, with frequent failure for molecular assemblies with more than 10,000 atoms. Many hundreds of Chimera users have reported this defect of our current UCSF Chimera visualization software. Literature on surface calculation often compares different algorithms, and invariably reports that the SES algorithms fail in many cases.
This year we developed a new algorithm to compute solvent excluded surfaces using a distance grid technique (http://www.cgl.ucsf.edu/chimera/data/surface-oct2013/surface.html) that gives excellent appearance, closely approximates the analytic surface shape, is as fast as analytic methods, and has no numerical instabilities. We have included this in our next generation visualization software.
Molecular surface area is another frequently used calculation, and the numerical instabilities described above have also plagued that code. Area calculations are most commonly used to determine the buried area between two proteins (area of protein A alone plus area of B alone minus area of A bound to B) giving a good indication of the strength of binding. Predicted molecular assemblies are often based on these area calculations. In conjunction with our new surface calculation code, we implemented a new analytic solvent accessible surface area calculation and tested it on all 100,000 PDB models, comparing results to a numerical approximation with all calculations in good agreement. The new area calculation will allow large scale processing of molecular databases such as predicting whether contacts observed in crystals are biologically relevant bound states or merely crystal packing artifacts.
[1]
Three-dimensional reconstruction of brain-wide wiring networks in Drosophila at single-cell resolution.
Chiang AS, Lin CY, Chuang CC, Chang HM, Hsieh CH, Yeh CW, Shih CT, Wu JJ, Wang GT, Chen YC, Wu CC, Chen GY, Ching YT, Lee PC, Lin CY, Lin HH, Wu CC, Hsu HW, Huang YA, Chen JY, Chiang HJ, Lu CF, Ni RF, Yeh CY, Hwang JK.
Curr Biol. 2011 Jan 11;21(1):1-11
PMID: 21129968
[2]
BigBrain: an ultrahigh-resolution 3D human brain model.
Amunts K, Lepage C, Borgeat L, Mohlberg H, Dickscheid T, Rousseau ME, Bludau S, Bazin PL, Lewis LB, Oros-Peusquens AM, Shah NJ, Lippert T, Zilles K, Evans AC.
Science. 2013 Jun 21;340(6139):1472-5
PMID: 23788795
[3]
Mature HIV-1 capsid structure by cryo-electron microscopy and all-atom molecular dynamics.
Zhao G, Perilla JR, Yufenyuy EL, Meng X, Chen B, Ning J, Ahn J, Gronenborn AM, Schulten K, Aiken C, Zhang P.
Nature. 2013 May 30;497(7451):643-6
PMID: 23719463