Tom Goddard
July 17, 2014
Here are some Chimera software development aims for Ed Egelman's NIH grant proposal for an R25 education project grant.
Specific Aim X: Enhance molecular visualization software to allow biology researchers to create planetarium shows. Today only a handful of researchers have access to dome facilities and computer programming skills to produce planetarium shows. This aim will open production of shows to thousands of biology research labs, presenting the latest disoveries to inspire students.
It is exceedingly difficult to produce compelling planetarium presentations showing molecular biology, requiring access to a dome to test and refine ideas, and computer programming to implement them. A few software developments will allow biology researchers to create planetarium shows without requiring access to a dome or programming skills, and enable presentation of live immersive tours tours through the latest biological data, that have far greater effect inspiring students than pre-recorded videos.
The need to test visualizations on a dome over a period of weeks or months required to create a show greatly limits who can develop dome content. Almost no one has access to a planetarium dome, and many potential developers of biology dome shows have no dome at all in their city.
It is difficult to develop effective visualization for a dome environment by testing ideas on a conventional flat-panel display. Rules of thumb can be applied. Experienced planetarium producers say that motions on the dome should be about 3 to 5 times slower than what would be typical for a video shown on a conventional flat display. This allows the viewer to look around, and also avoids inducing nausea when objects encompassing the viewer's whole visual field move too fast. Showing a video made for a flat screen on the dome results in the objects appearing very small, because the angular field of view on a flat screen is small, about 30 degrees, while in a dome a person can see an almost 180 degree wide field without moving their head. Another critical limitation of developing dome visualizations on a flat display is that it is hard to assess what data views and motions will be spectacular on the dome, and leave a lasting impression on viewers. A primary reason for using a dome is because of the awe inspiring views of brain wiring or influenza virus or the molecular factory inside cells that being embedded in the scene can produce. Creating that inspiration requires testing visualization ideas on a dome.
|
|
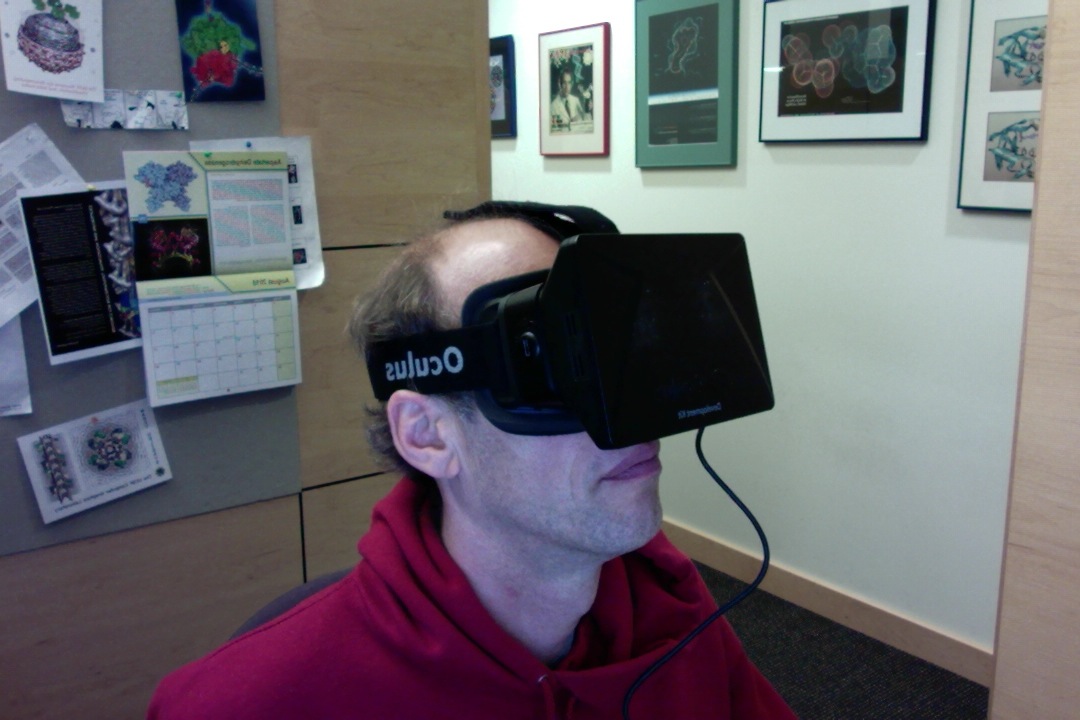
| Figure 1: Oculus Rift virtual reality head set. |
A simple, practical and inexpensive solution for testing dome visualizations will soon be widely available, stereo goggles such as the Oculus Rift from Facebook and the virtual reality headset from Sony. This technology is essentially a cell-phone size flat-panel display in a pair of ski-goggles, that provides 3d visualization in your entire field of vision, including the ability to turn your head and look behind you or in any direction. Using a developer version of the Oculus Rift we have tested immersive display of molecular data in our next generation Chimera software. In order to use this to preview dome visualizations requires additional software development to project the 3-d molecular scene onto a virtual dome that will be viewed with the goggles. This will allow live testing of dome visualizations ideas using this small desktop device.
Stereo goggles are expected to be inexpensive and widely available. The Oculus Rift first developer version released in January 2014 cost $300, and a second developer version with higher resolution display was released in July 2014 for $350. The the consumer version is expected to be released in early 2015 for a comparable, affordable price. The first Oculus Rift developer version sold 50,000 units, and as of July 2014 the second version already has a back-order of another 50,000 units. These are intended only for software developers as there is little application software available. It is expected that a consumer unit will sell millions of units, with a primary use of playing video games. The expectations that the device will be popular are high -- Facebook recently acquired Oculus Rift for $2 billion, a large sum considering that one million units at $500 each would only generate $500 million in gross sales. If these devices become widely available, the dome shows developed for planetariums can be made available for viewing by students using goggles. This offers a substantial advantage over the dome that the molecular data would not be projected onto a 2-dimensional surface. The molecules and microscopy data would appear fully 3-dimensional floating in front of the viewer.
|
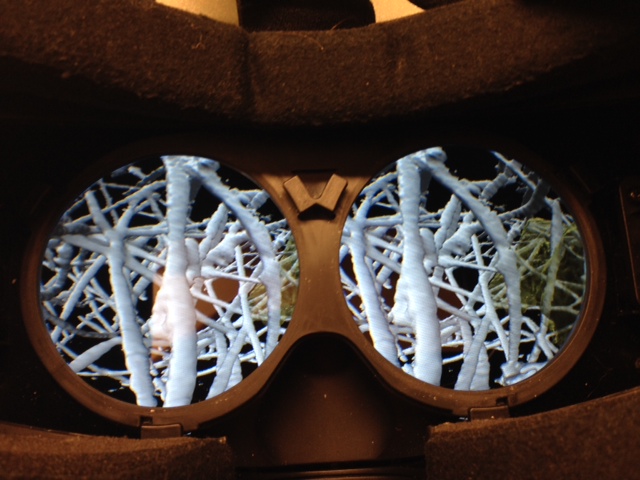
| Figure 2: Stereoscopic immersive view of immune system cells moving in collagen matrix. Oculus Rift lenses are not shown. |
Development of stereo goggle immersive visualization capability in the next generation Chimera molecular visualization software will enable development of planetarium show content, and also allow tours of data that can be viewed and interactively manipulated directly using goggles by students. The planetarium and stereo goggle biology shows each have unique advantages. A planetarium dome allows hundreds of students to learn about recent biology and encourages discussion through the group viewing. Stereo goggles offer a more compelling 3-dimensional view of the data, and allows interactive control where the viewer can make deviations from the precomposed tour, which can heighten engagement in the science.
The software effort to allow use of stereo goggles is substantial. We have spent 2 person-months to enable basic molecular visualization with Oculus Rift goggles. This involves writing graphic processor (GPU) programs to make spherical aberration and chromatic aberration lens corrections, processing head tracking information to update the view at 60 frames per second, enabling flight through scenes with game controller devices, avoiding collisions when the viewer interactively flies through data, and providing user interface to control the virtual size of the viewer and depth of field (the effective eye separation in a molecular scene). Some of this supporting software is specific to the Oculus Rift device, so that support of goggles from other manufacturer's will require additional software development. Details of our prototype work on the Oculus Rift are described on the web (http://www.cgl.ucsf.edu/chimera/data/oculus-jan2014/oculus.html).
The barrier for molecular biology researchers to produce planetarium shows is high because the graphical effects needed to display their data in a compelling way in many instances require computer programming. Our software developments will make special effects that make clear the beauty of the scientifically possible without requiring custom computer programming.
|
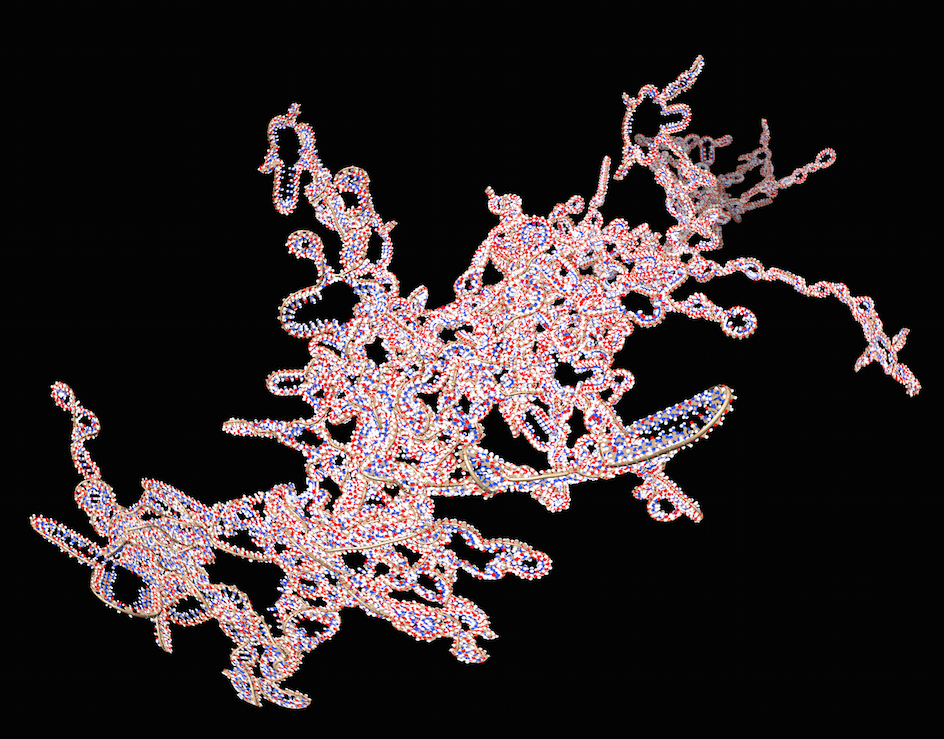
| Figure 3: HIV virus RNA shown wiggling in the opening of planetarium video http://youtu.be/i-__ufO9LYg. |
Inspiring middle school students or any non-scientists with the amazing discoveries of molecular biology is not easy. This proposal aims to inspire the students with rich visual data of the microscopic world, using a medium that has been successful for the astronomy community, namely planetarium domes. A key stumbling block is that many of the beautiful molecular biology models and image data is static, for instance a rigid protein structure determined by x-ray crystallography, or imaging of brain tissue by electron microscopy. While scientists having deep knowledge of their subject find this static 3-dimensional data fascinating, it has much less hold on the imagination of non-scientists. The data is visually much less engaging than their everyday view of the dynamic visual world. Techniques such as morphing between two experimental data sets, or illuminating paths of electrical signals in the brain, that add temporal qualities, as opposed to flying around a still and sterile scene, create much of the inspiration in dome shows. The software capabilities to show properties of static data using time-varying effects is essential for conveying science to students in a way that holds their attention.
|
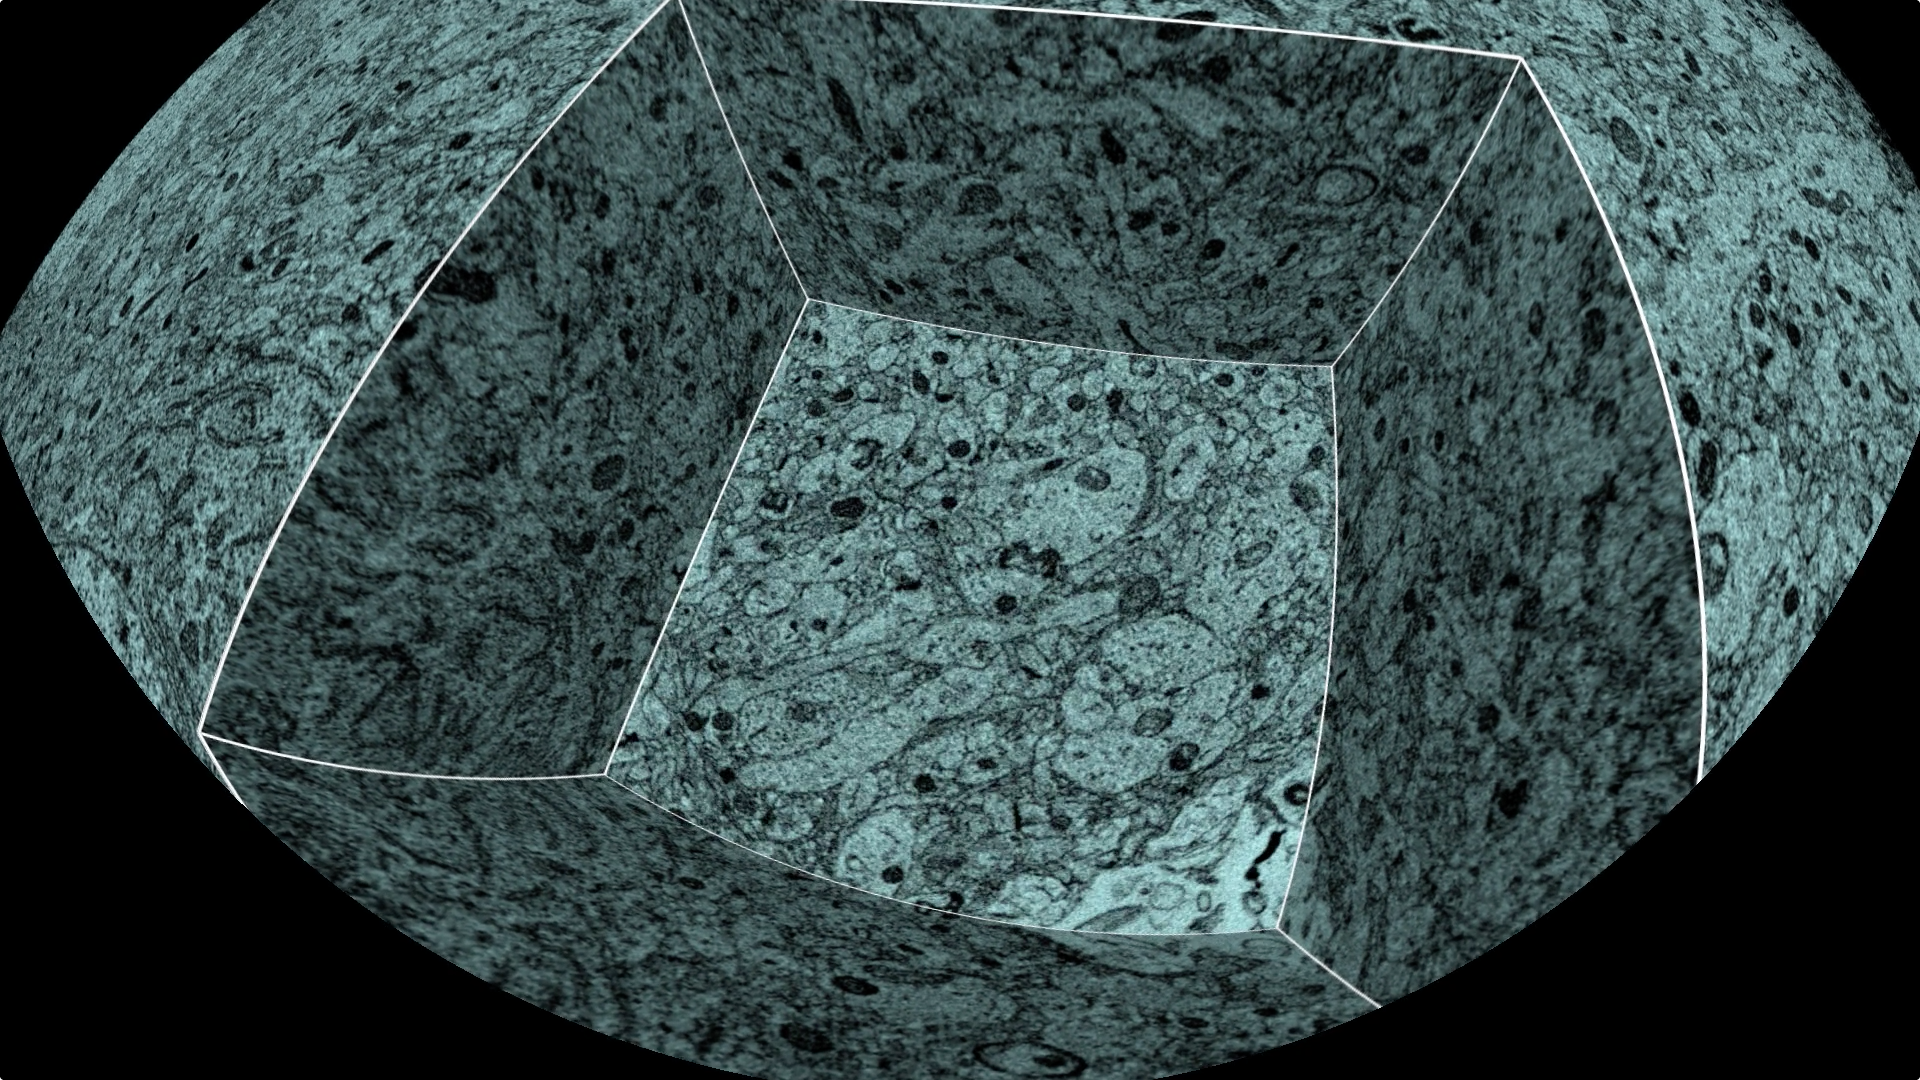
| Figure 4: Tunneling into electon microscopy at minute 1:35 of human brain planetarium video http://youtu.be/RE2XMzInX_o. |
In 2012 we produced our first planetarium video presented in a portable dome at the Biophysical Society conference and also screened at the Fleet Planetarium in San Diego. The topic was the life cycle of the HIV virus RNA molecule, showing many of the viral proteins that replicate the virus. The opening scene shows a model of the 10,000 base RNA molecule based on experimentally determined secondary structure. To enliven this rigid 3-dimensional model we wrote computer code to wiggle all the stem-loops of the RNA at frequencies inversely proportional to their size, and this is used in the opening scene of the animation (figure 3). The entire HIV dome video consisted of many segments that used specialized code to animate the real experimental data, such as walking a transcription enzyme along the RNA. A summary can be seen in the storyboard (http://www.cgl.ucsf.edu/chimera/data/hiv-rna-jan2012/story.html). The custom computer programming effort for this 6 minute dome animation was approximately 1 full month of programmer time.
|
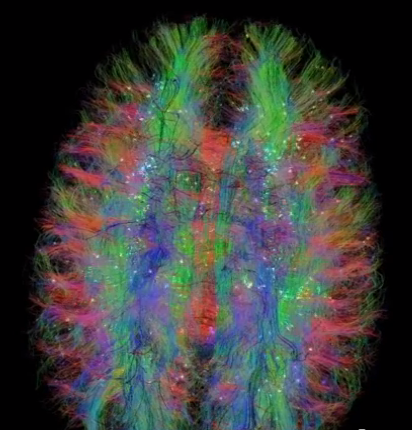
| Figure 5: Highlighting neural tracks in diffusion tensor imaging of the human brain with moving lights. http://youtu.be/WyJSFK_WnBo. |
In 2013 we produced a planetarium animation showing the human brain from optical microscopy of the whole brain down to molecular ion channels responsible for neural transmissions. It was shown at the Biophysical Society meeting in early 2014. Many viewers of the show cited a specific segment that captivated them, where you tunnel into a 3-dimensional electron microscopy of rat cortex, gradually uncovering like an archealogical dig layers tightly packed neurons, and it appears all around you (figure 4). Forming this tunnel required special computer programming to drop the floor of the tunnel while showing the walls, with the tunnel walls, floor and exterior surfaces of the electron microscopy data depicted using 13 rectangular slices.
In June 2014, Jonathan Fisher, presented the first interactive planetarium show of the NeuroDome project (http://www.neurodome.org). One of the most captivating visual displays showed diffusion tensor imaging revealing detailed neural tracks in the human brain. They used a visual effect of hundreds of traveling lights along the tracks to mesmerizing effect, and provide a clearer view on the tracks then possible with a static depiction. They also used red, green, and blue coloring to distinguish tracks aligned along orthogonal axes. These effects were programmed specifically for this data and show, the tracking lights using a graphical processor shader program.
The preceeding three examples illustrate how an important part of the magic of a dome show is based on specialized computer generated effects requiring custom made computer software. This greatly limits the production of planetarium material requiring a team with both biology and computer programming expertise. An aim of our proposal is to make a toolbox of these special effects accessible to biology researchers with no computer programming. By allowing a biology researcher to directly compose dome animations of their data without a difficult to arrange and expensive collaboration with computer programmers will result in many more dome presentations of biology. The special effects described above are a few examples that have been applied to specific data sets. The computer programming effort to create a one-off special effect is a relatively small portion of the effort needed to make a user interface that allows that special effect to be used by a non-expert biology researcher.
Two factors make traditional planetarium shows more engaging than watching a video on a flat screen in a classroom. They offer 360 degree immersive visuals, and second, planetarium shows traditionally are interactive rather than pre-recorded. An astronomer or knowledgable presenter gives a live tour, controlling what is shown and explaining it. This difference is much like watching a live theater performance, versus a video of a performance. The live performance offers suspense and in a planetarium context can be influenced by questions from the audience. The live performance aspect of planetarium shows is as important as the immersive quality. Viewers are disappointed with prerecorded planetarium shows, feeling a planetarium is expected to be more than an IMAX big screen movie theater, http://athwart-history.blogspot.com/2011/03/decline-of-planetariums.html.
Possibly the first live biology planetarium show was presented in June 2014 at the Morrison Planetarium in San Francisco by Jonathan Fisher of New York Medical College showing the 3-dimensional architecture of the brain. This required a remarkable team with Jonathan and his lab providing biological data and presenting, and Patrick McPike, technical director of the Adler Planetarium in Chicago driving the visual tour, with custom software programming by Swedish company SCISS to adapt their Uniview planetarium system to show the non-astronomical data.
For the past three years the annual Biophysical Society Conference attended by about 7000 researchers has hosted a portable dome for presentation of molecular biology. To date all of the screened material has been pre-recorded. For reasons discussed in aims A and B above it is difficult to create successful prerecorded videos for the dome, and there have only been a handful of short videos screened at each conference. Allowing researchers to present their data live, instead of prerecorded, would enable many more researchers to contribute presentions. It is routine practice to present 3d biological data live using visualization software within research labs, as a tool for collaborative work. A relatively small effort, equivalent to preparing a talk, would be needed to show this data on a dome.
| 
|
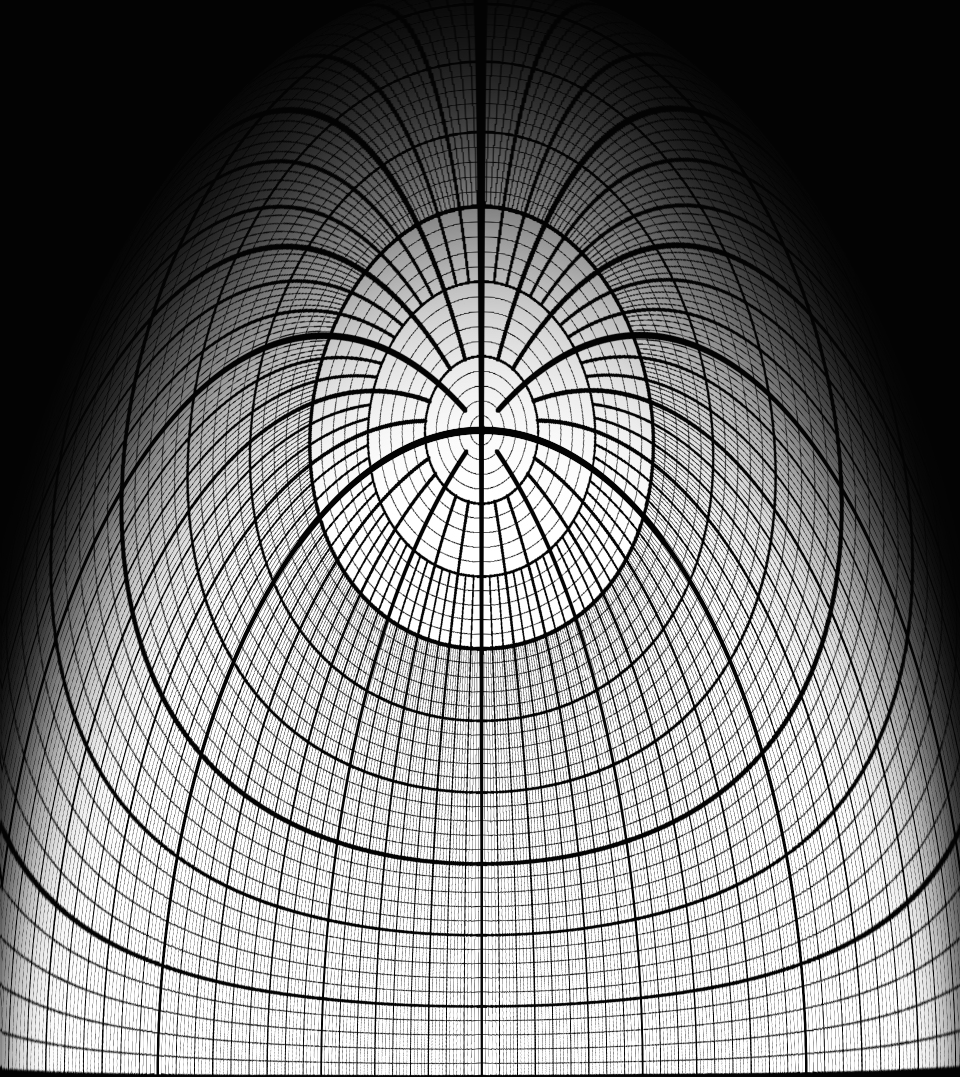
| Figure 6: Spherical mirror projection requires graphics warping by software used for interactive presentations. | Figure 7: Warp map to apply after a fish-eye projection to project an undistorted image using a spherical mirror projection system. |
There is a significant technical obstacle to interactive dome presentations. Existing molecular visualization software produces graphics for a flat, narrow field-of-view screen. For dome display graphics must be warped to produce an undistorted image using the optics of the dome projection system. A common configuration in portable domes uses a conventional projector reflecting off of a flat mirror, then a spherical mirror onto the hemisphere of the dome (figure 6). Molecular graphics must be warped to appear undistorted on the dome (figure 7). This is a relatively easy procedure using modern computer graphics. The main development required is to support a range of standard projection geometries, using an established planetarium warp map file format. We will add this capability to the widely used molecular graphics software UCSF Chimera.
Pre-recorded videos with audio narration allow wide distribution to students. A presenter with special knowledge of the data and skills to drive visualization software is not required. But students are saturated with videos on all topics making it hard to create an inspiring experience of science with this medium. A goal of this project is to allow interactive presentations to be distributed and performed by non-expert presenters. We envision a web page laying out the script of a molecular biology show, including images, links to background material, and links that control the Chimera visualization software to load specific data, initiate dynamic actions such as morphing between molecular structures or tunneling into imaging data, and display visualization software controls in Chimera that will let the live presenter or students deviate from scripted views to explore the data in unexpected ways. A packaged presentation will consist of this biology story script and a directory of data files derived directly from experimental data. Our software development will enable the links in the web page to control the visualization software to eliminate the need for the presenter to have detailed knowledge of the Chimera molecular visualization software, allowing for example a middle school science teacher to present cutting edge biology with real data.