Tom Goddard
November 19, 2007
Progress this year
Who are our current EM users?
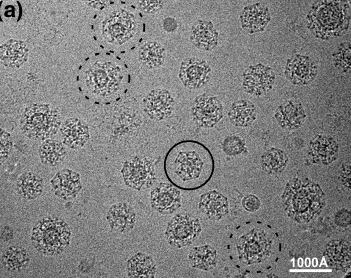
Most Chimera EM users study molecular assemblies with single particle reconstruction (back-projecting thousands of 2-d particle images).
Chimera map visualization tools have been developed for this audience for 6 years with primary collaborator Wah Chiu, director of the National Center for Macromolecular Imaging (NCMI).
Chimera map capabilities are described in Guide to Volume Data Display. Display, fitting, carving, and measuring maps and handling large multimeric atomic models (viruses, ribosomes, filaments, ...).
Estimate 500-1000 EM Chimera users based on email support requests from ~100 distinct users per year.
Estimate 50-100 EM tomography users based on email correspondence.
Chimera has been used for exploring EM tomograms (calculated from tilt series of single specimens) although we did not develop tools specifically for this use until this year.
Strong encouragement from collaborators
Growing literature of tomography applications to molecule-scale architecture, where Chimera map and atomic model capabilities have been used.
Some published examples using Chimera for EM tomography (all completed before we added specific tomography support).
Clathrin vesicles, Yifan Cheng.
Cheng Y, Boll W, Kirchhausen T, Harrison SC, Walz T.
Cryo-electron tomography of clathrin-coated vesicles: structural implications for coat assembly.
J Mol Biol. 2007 Jan 19;365(3):892-9.
|
|
|
|
| In vivo clathrin cages have many topologies. | Modeling a cage from tomogram. | In vitro prepared clathrin allows averaging. |
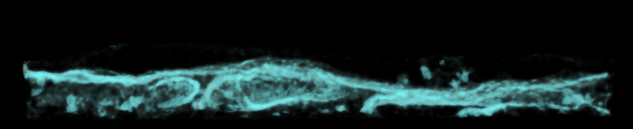
Stereocilia molecular linkers (unpublished), Manfred Auer lab.
| 
| 
| 
| Traced links composed of a few molecules. Scale bar 100 nm. |
| SEM of hair bundle | Tomogram section of tip links. |
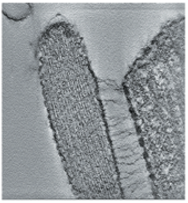
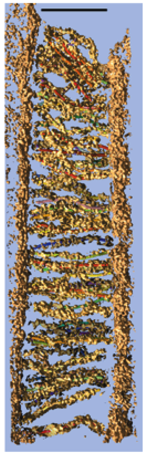
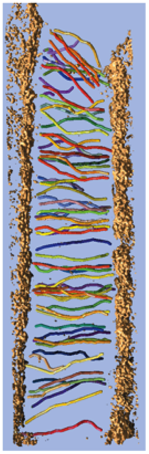
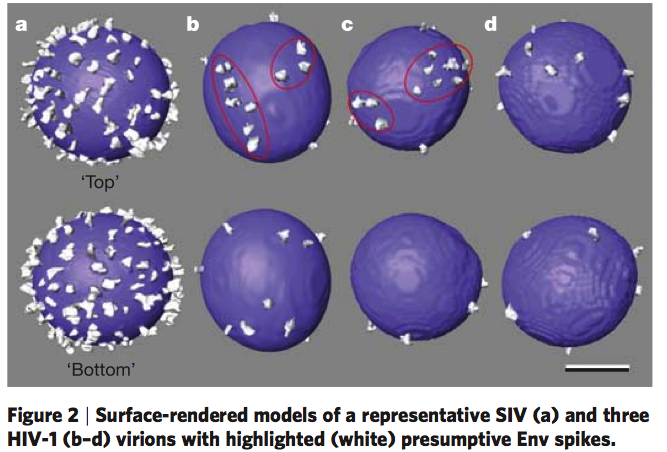
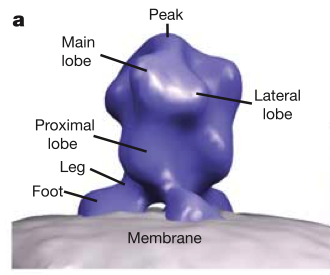
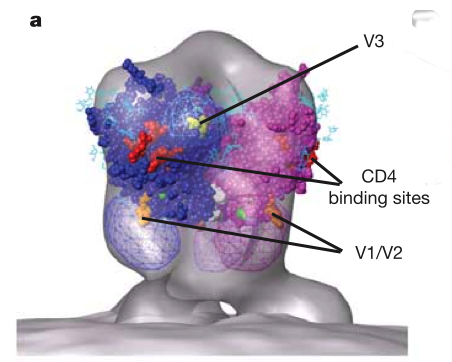
HIV glycoprotein spikes, Roux lab.
Zhu P, Liu J, Bess J Jr, Chertova E, Lifson JD, Grise H, Ofek GA, Taylor KA, Roux KH.
Distribution and three-dimensional structure of AIDS virus envelope spikes.
Nature. 2006 Jun 15;441(7095):847-52.
| 
| 
|
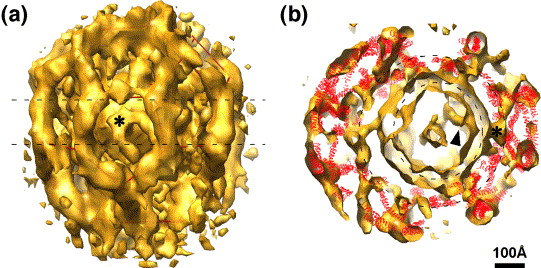
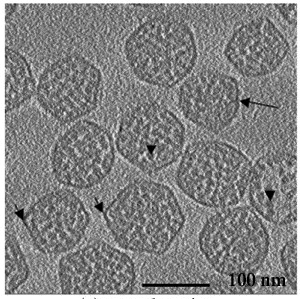
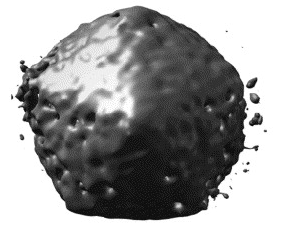
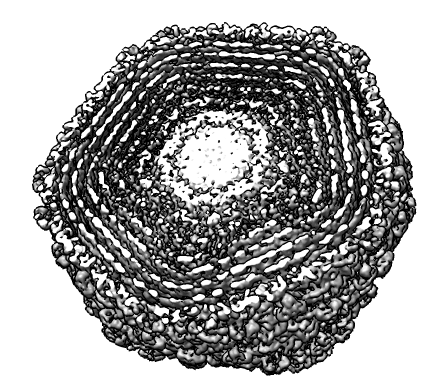
Carboxysomes, Michael Schmid (co-director of NCMI).
Schmid MF, Paredes AM, Khant HA, Soyer F, Aldrich HC, Chiu W, Shively JM.
Structure of Halothiobacillus neapolitanus carboxysomes by cryo-electron tomography.
J Mol Biol. 2006 Dec 1;364(3):526-35.
| 
|
| Carboxysomes encapsulate RuBisCO in cyanobacteria. | Averaging 21 tomogram particles with diameter ~100 nm suggests arrangement of capsid molecules. |
Herpes virus portal, Wah Chiu lab.
Chang JT, Schmid MF, Rixon FJ, Chiu W.
Electron cryotomography reveals the portal in the herpesvirus capsid.
J Virol. 2007 Feb;81(4):2065-8.
 Herpes simplex virus. Tomographic sections of several particles. | 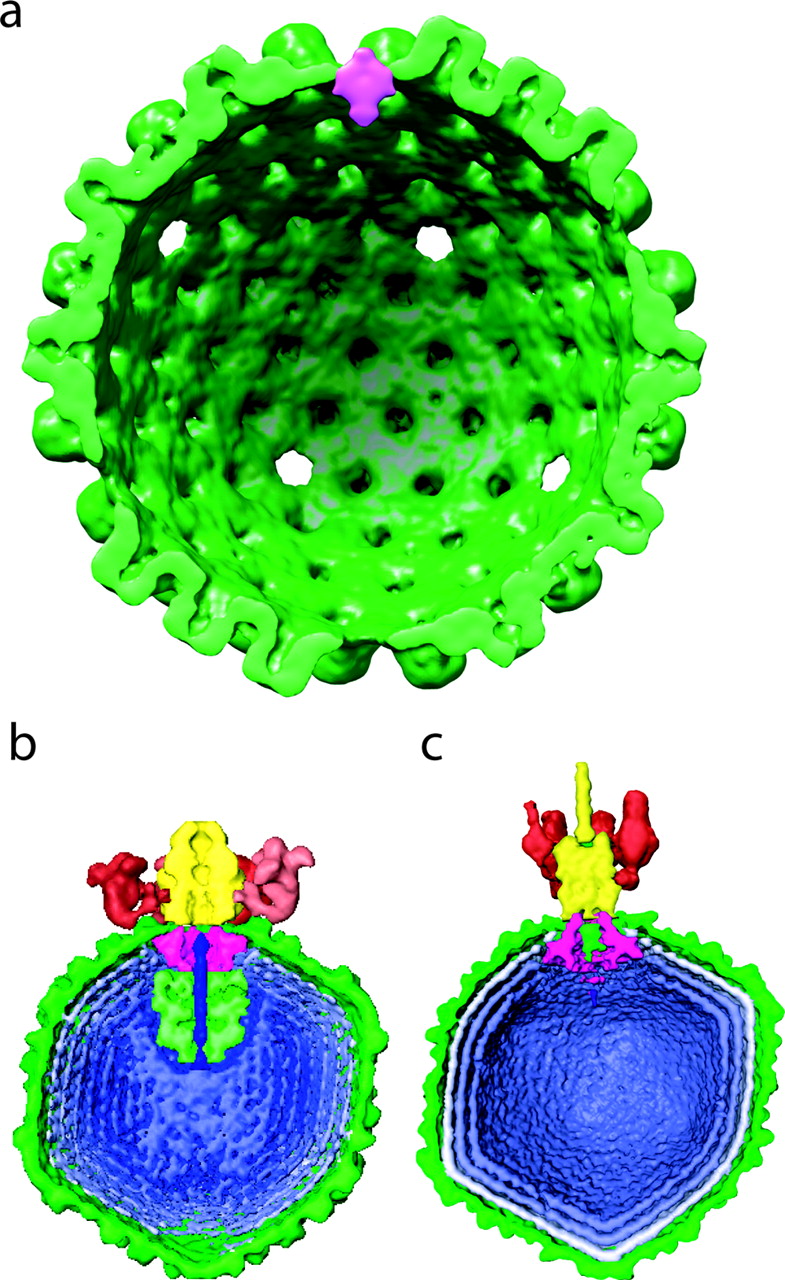
| One of 12 vertices occupied by a portal of nearly equal mass to 11 pentons. Tomographic reconstruction used to identify portal vertex and 13 particles averaged. Large Epsilon 15 and P22 virus portals shown for comparison below. |
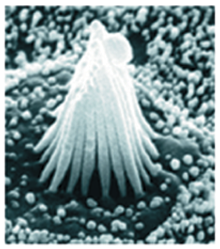
Example: Human cytotoxic T-cell killing neighboring cell.
Stinchcombe JC, Majorovits E, Bossi G, Fuller S, Griffiths GM.
Centrosome polarization delivers secretory granules to the immunological synapse.
Nature. 2006 Sep 28;443(7110):462-5.
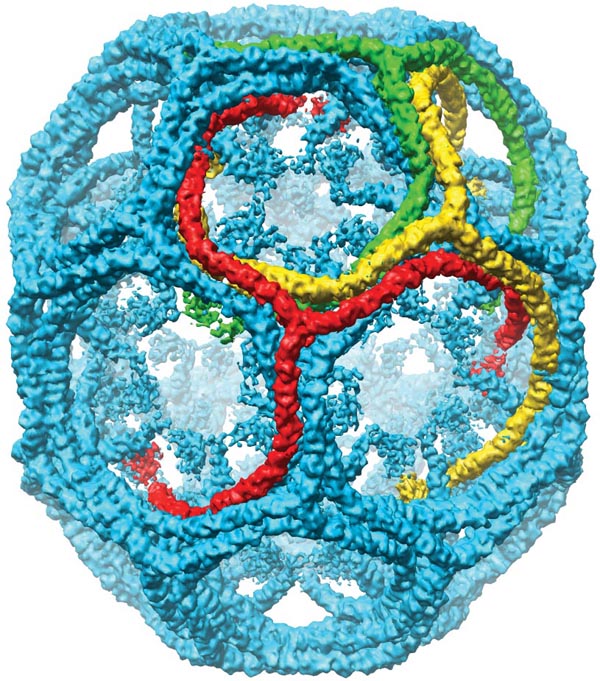
Displaying segmentations. Can read IMOD segmentation files, hide, show, split, color, measure enclosed volumes (with holes) and surface areas of objects.
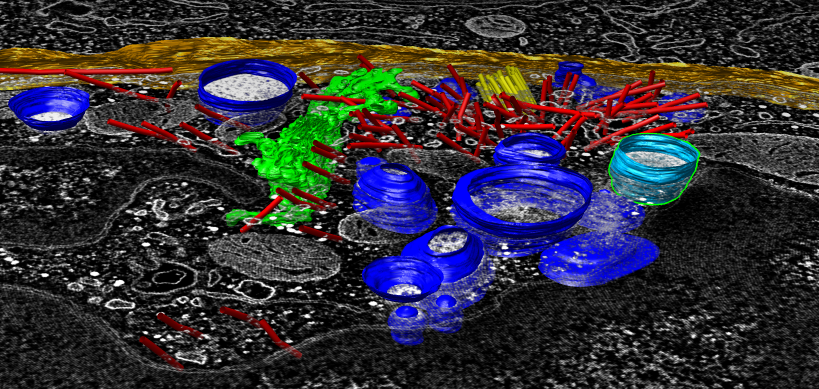
IMOD segmentation of tomogram: lysosomes (blue), microtubles (red), centriole (yellow), golgi (green), cell boundary (orange). |
Single plane display is most effective view due to high noise level. Contour surfaces, the common display style for single particle reconstructions, are much less useful.
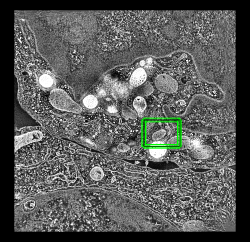
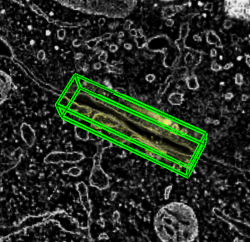
Full plane with subregion in green. |
Resampling. Extract subregion with axes rotated relative to full data. Interesting structures are generally not aligned with tomogram axes.
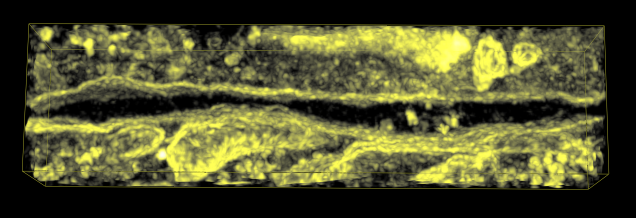
Masking. Extract density bounded by IMOD segmentation surfaces.
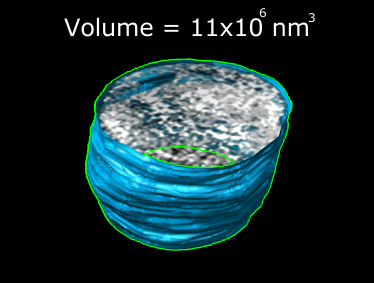
Mask data within selected lytic granule. | 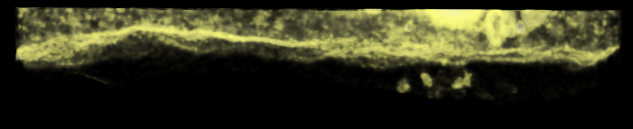
|
Volume masked above and below cell interface. |
Slice plane at any orientation.
Masking capability for tomography is also useful for single particle reconstructions.
Phage K1E. | 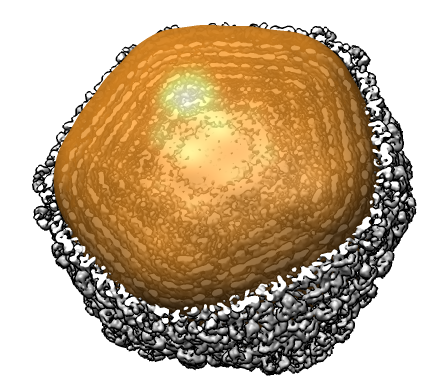
Contour surface of Gaussian smoothed data separates protein capsid from DNA genome. | 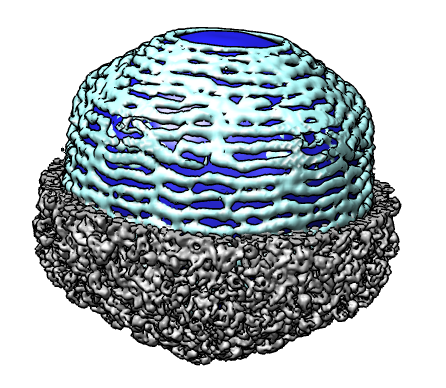
Masked DNA shows spiral packaging. |
Morph MapNew morph map tool linear interpolates between maps. Effective method for viewing differences between related maps. Most EM Databank maps belong to sets of related maps. Original Chimera code contributed by Wei Zhang from Pawel Penzcek's lab. Two conformations of human RNA polymerase II. |
Clash Detection While FittingNew detect clashes tools shows steric clashes as yellow lines while model is interatively hand-fit or locally optimized. Symmetry copy command makes copies of contacting monomers. Fitting alpha and beta tubulin into a microtubule map. |
We promote Chimera through demonstrations and hands-on tutorials at meetings:
and through publications.
1) Masks for density maps: file formats, creating and applying masks.
2) Tomography filters: bilateral, median, anisotropic diffusion.
3) Seamless user interface for atomic models of molecular assemblies.
Four software development areas of our molecular assemblies NCRR core project: