Tom Goddard
November 9, 2017
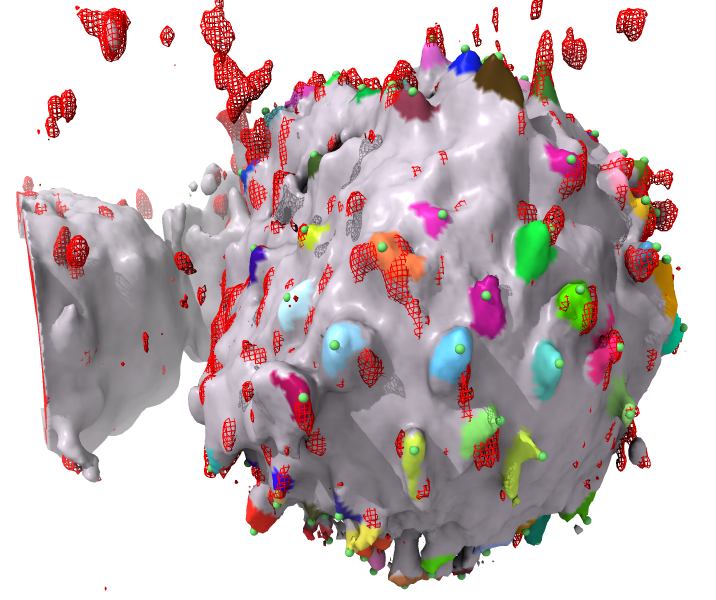
The bumps command marks protrusions on 3D light microscopy of cells and can measure the signal intensity from another micorscopy channel within each protrusion and report these values in a text table. This was developed for En Cai in Matthew Krummel's lab at UCSF.
Source code is available in our git repository and is also part of the ChimeraX distribution (on Mac under ChimeraX.app/Contents/lib/python3.6/site-packages/chimerax/bumps).
Mark all protrusions of map one using center point defined by model #2 (a single marker), with protrusion base area 100, height 1, and maximum distance from center 75.
To place the single marker at the center of the cell one method is to use the marker placement mouse mode (the yellow ball on gray surface in the column of mouse mode icons on the left edge of the ChimeraX window). Use the "Place marker at center of connected surface" mode set in the "Markers" panel that appears on the right when the mouse mode is enabled. Use a threshold for the map so that the cell of interest is not connected to other cells, and right click on that cell to place the single marker.
Height, distance and area are in physical units, typically micron and micron**2. The distances used in this example are not in microns because the 3D image data used did not have the voxel size set in microns, instead it defaulted to voxel size 1, so the distances are in image grid index units.
bumps #1 center #2 height 1 base 100 range 75
Output a text table one line per protrusion listing id number, tip position grid index, number of grid points in protrusion, height of protrusion, and sum of intensity values in a second map.
bumps report #3 save ~/Desktop/prot.txt signalMap #4
    # BMDC_NoSL8.tif
    #  119 protrusions, base area 100, minimum height 1, cell center ijk 97.52 78.18 70.71, range 75
    # id    i    j    k   points   height  signal
       1  154   73   28    146     5.222      7856
       2   36   52   88    107     5.503      5467
       3   56   64  121    266     12.98     16641
       4   44   54  102    145      3.44      5067
       ...
Mark protrusions in 3D image data:
      bumps volume center point
        [range number] [baseArea number] [height number]
        [markerRadius number] [markerColor color] [colorSurface true|false]
        [name text] [allExtrema true|false]
Output table reporting protrusions in 3D image data
bumps report [bumps model spec] [save filename] [signalMap map]
| volume | Map to find protrusions on. Highest surface contour level used. |
| center | Point which is the cell center for finding radial protrusions. Often this is the model number of a single marker placed at the center of the cell by hand. |
| range | How far out from center to look for protrusions. Physical units (typically microns). |
| baseArea | Area of base of protrusion. Protrusion is extended inward until this area is attained and that defines the protrusion height. Physical units (typically microns**2). |
| height | Minimum height of a protrusion to be marked. Physical units (typically microns). |
| markerRadius | Size of marker spheres to place at protrusion tips. Physical units (typically microns). |
| markerColor | Color of markers placed at tips of protrusions. Default light green. |
| name | Name of created marker model. Default "bumps". |
| allExtrema | Whether to mark all radial extrema even if the don't meet the protrusion height minimum. Markers within another protrusion are colored yellow, ones that never attain the specified protrusion base_area (often smal disconnected density blobs) are colored pink, markers on protrusions that are too short are colored blue. |
Find protrusions on T-cells in 3d light microscopy.
The algorithm marks the surface points that are a local maximum in distance from the center, then it measures the height of the protrusion by extending toward the center from a marked point until the protrusion base cross-section area is exceeded -- how far down it goes to achieve the specified base area is the height of the protrusion. It rejects and protrusions that are too short (less than the specified height). Also it drops marked blobs that are not connected (don't have a base with enough area), and it eliminates marked points below others on the same protrusion that are found while measuring the height of a protrusion.
Is the code likely to miss one of two protrusions that are very close to each other?The algorithm will consider two close peaks on the cell surface as one protrusion. It starts at the most distant point on the protrusion from the specified cell center, then adds grid points toward the base of the protrusion until the specified base area is attained. If two or more peaks are above that base area then they are all considered part of the same protrusion, only the marker on the highest peak is placed, and the volume mask for the protrusion includes all the grid points above the base area. You could choose a very small base area so that one peak does not spill over into another peak. But you will get many spurious peaks because most protrusions have several points that are at local maximum distance from the center. The bumps command lets you play with the parameters like base area.
How does the code deal with protrusions that are tiled, bent, i.e. not perpendicular to the cell surface?The algorithm assumes protrusions are approximately radially oriented since it starts with points that have distance from a center point that is a local maximum from the specified cell center point.